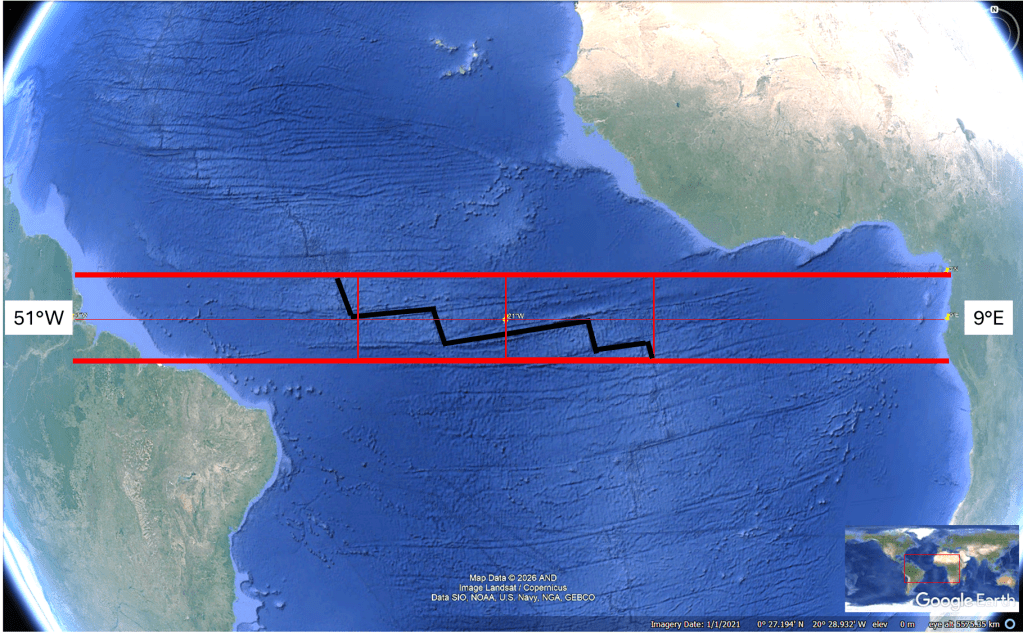
What is special about the equatorial section of the Mid-Atlantic Ridge? This segment extends across roughly one third of the distance between South America and Africa along the equator — approximately 20° of longitude within the roughly 60°-wide Atlantic Ocean at equatorial latitudes. The geometrical midpoint of the Atlantic at the equator therefore lies near 21°W, with about 30° extending westward to the coast of South America near 51°W and about 30° eastward to the African coast near 9°E.
When examining the zigzag geometry of this section of the Mid-Atlantic Ridge, an additional symmetry appears. The major deviations toward more northerly and southerly alignments occur at approximately equal distances from this central point, around 9° to either side. If one considers a basic upper-mantle convection-roll width of roughly 1.5°, together with a broader large-scale equatorial spacing pattern of about 30°, the geometry becomes particularly intriguing.
Naturally, this section of the Mid-Atlantic Ridge has been studied extensively using the full range of modern marine geophysical methods. The individual segments and fracture zones are well mapped and documented. Two of the most prominent equatorial fracture zones are the St. Paul Fracture Zone and the Romanche Fracture Zone, which together form a striking en-echelon pattern along the equatorial Atlantic.
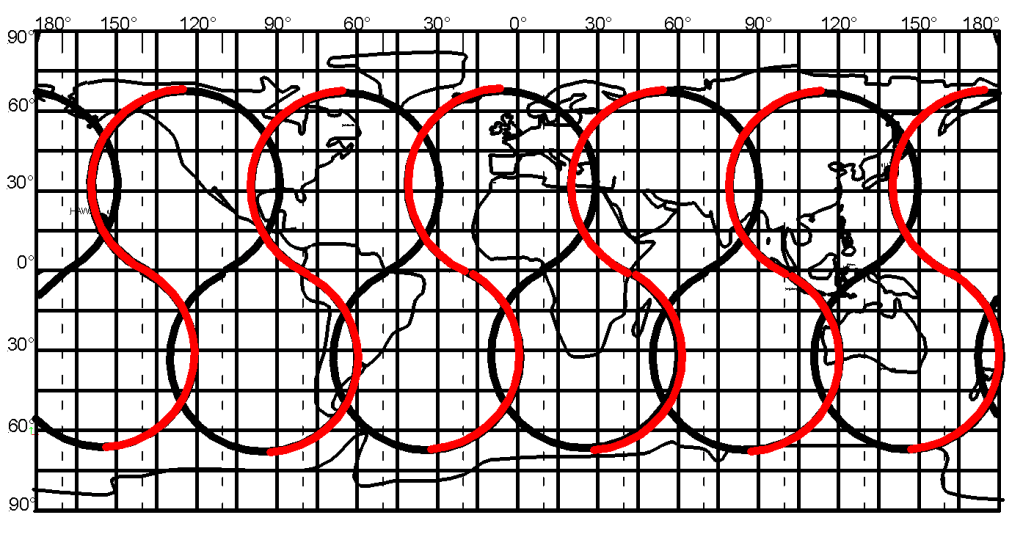
To realize the importance of the equator, the most basic map of convection rolls division lines can be added:
Basic convection rolls system – main lower mantle upwelling lines
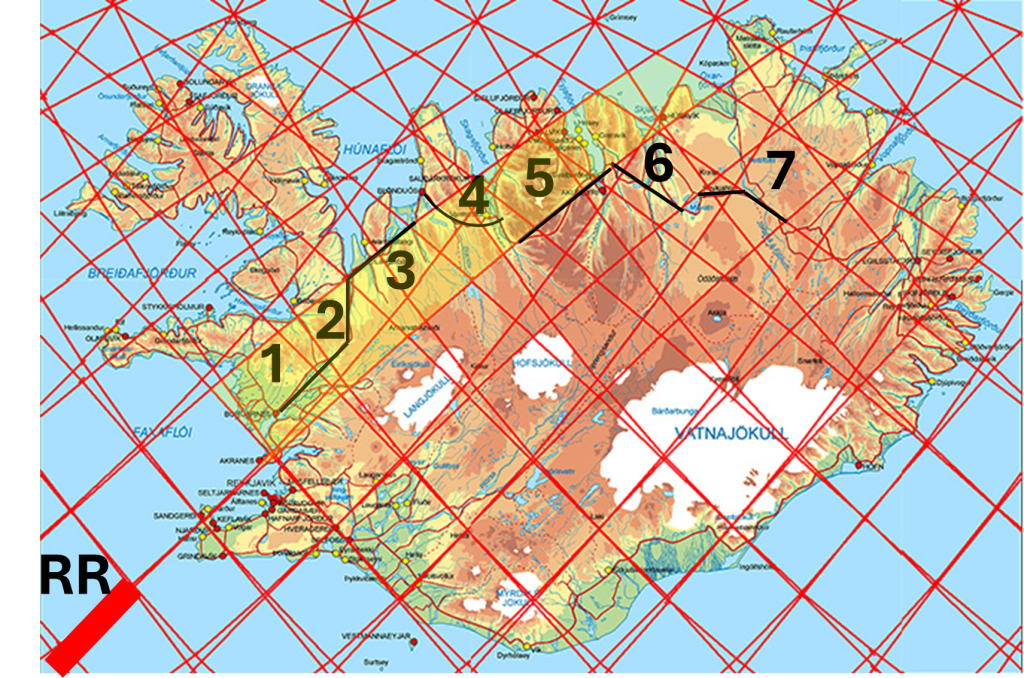
We can describe the route across North Iceland with reference to the map and its division lines. Note that the convection roll leading from Reykjanes Ridge main section is slightly coloured with yellow. Imagine setting out from Borgarnes in polygon 1 and driving up across Holtavörðuheiði. The road runs parallel to the division line until reaching the center of polygon 2, where it then turns directly north into Hrútafjörður. From there, the route bends toward the northeast, following the division line until arriving at the northern corner of polygon 3, where the road turns toward Blönduós.
The road onward into Skagafjörður curves repeatedly before turning inland, eventually entering Öxnadalur precisely at the boundary line adjoining polygon 5, the same line that defines the principal axis of the Reykjanes Ridge, continuing all the way to Akureyri.
From Akureyri to Mývatn, the main direction once again runs parallel to a division line, crossing one polygon, and thereby the other convection roll of the Reykjanes Ridge, from one side to the other (no. 6). To continue from Mývatn toward East Iceland, the route first heads directly east across a small polygon that appears to exert a major influence on the geology of the region. Beyond this point, the road follows the boundary of polygon 7 (the next convetion roll) until reaching the highlands of East Iceland.
Roads are, of course, constructed independently of geology or geological principles. Nevertheless, the landscape itself strongly influences where it is most practical to build them. If the boundaries formed by mantle convection rolls are indeed real, then they reveal themselves in various ways across the terrain. With this in mind, one may consider, while travelling from one region to another, which geological processes and structural influences may have shaped the environment within each individual section of the journey.
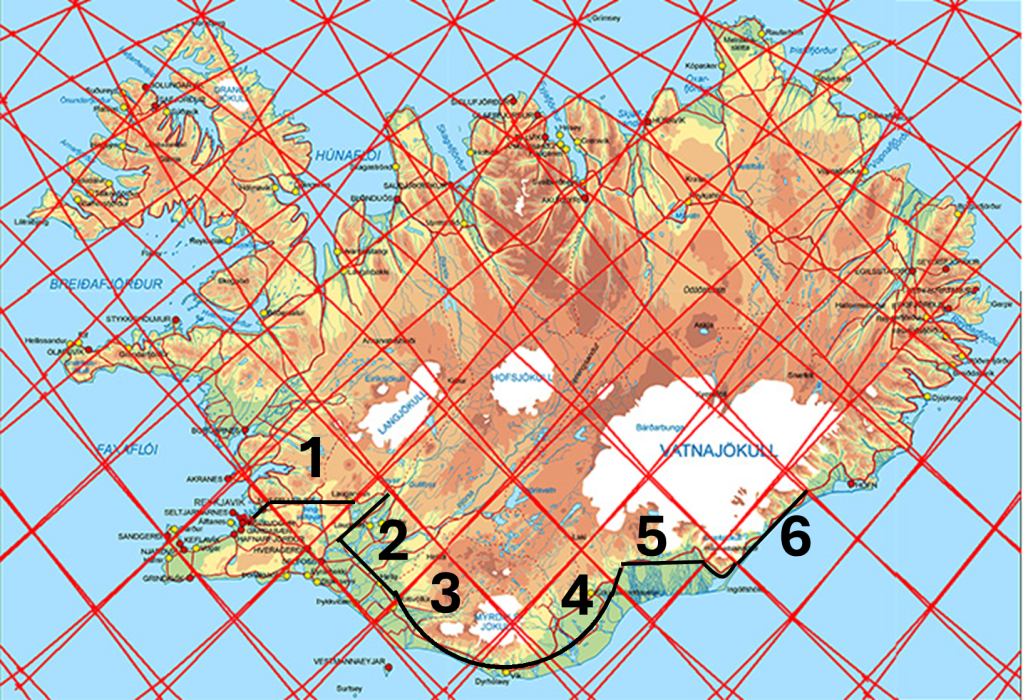
The six “chapters” of the tourist route through South Iceland
For the first chapter marked on the map, you visit Þingvellir National Park. In order to get there, you pass through the highland structure of the West Volcanic Zone, and at its central axis you find the rift valley of Þingvellir. You then drive all the way to Laugarvatn, where abundant geothermal activity is found along the boundary of polygon 2. From there, you turn north until you reach the Geysir area and Gullfoss at the northern end.
If you wish to continue to other scenic areas in the south, you can follow the main road running parallel to the boundary between polygons 1 and 2 until you reach the Ring Road, where you make a 90° turn toward the southeast. The road remains fairly straight until it crosses the boundary between polygons 2 and 3. After that, it curves around the two glaciers Eyjafjallajökull and Mýrdalsjökull.
Polygon 3 is centered around Eyjafjallajökull and includes two famous waterfalls: Seljalandsfoss at its western end and Skógafoss on its southern slopes. After passing the town of Vík í Mýrdal, at the southernmost point of Iceland, you enter chapter 4.
There, you pass two enormous lava fields, the largest on Earth formed in recorded history, one from the Eldgjá eruption of 939 and the other from the Laki eruption of 1783. There are two parallel roads there, and you would probably choose the northern one (road No. 1), but I chose the southern one for illistration 🙂 At the boundary between polygons 4 and 5, another turn is made to the right, crossing that polygon and passing the glacial rivers flowing from Vatnajökull. This area is generally known as Skeiðarársandur.
Upon reaching the end of polygon 5, you drive around Öræfajökull, the largest volcano in Iceland. Entering polygon 6, you are on the road toward the Glacier Lagoon, Jökulsárlón. You can then continue along the road running parallel to the side of the polygon all the way to the eastern end.
If you notice other roads that fit this pattern in a similar way, convection rolls underneath affecting the road system, it would be very interesting to examine them as well.
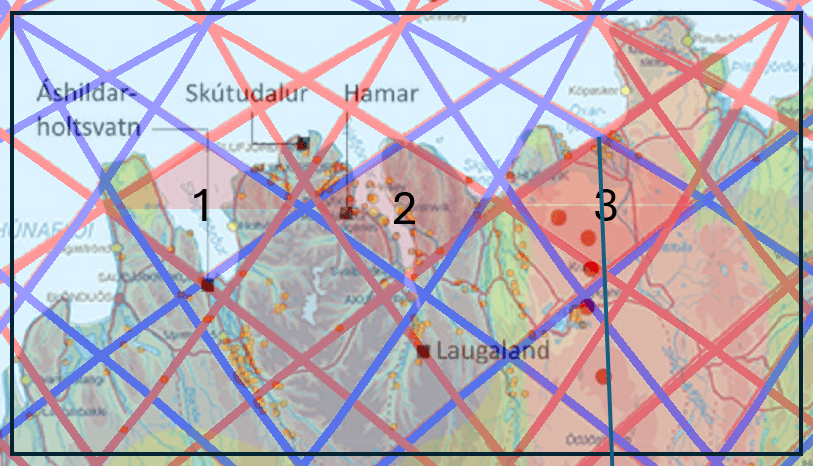
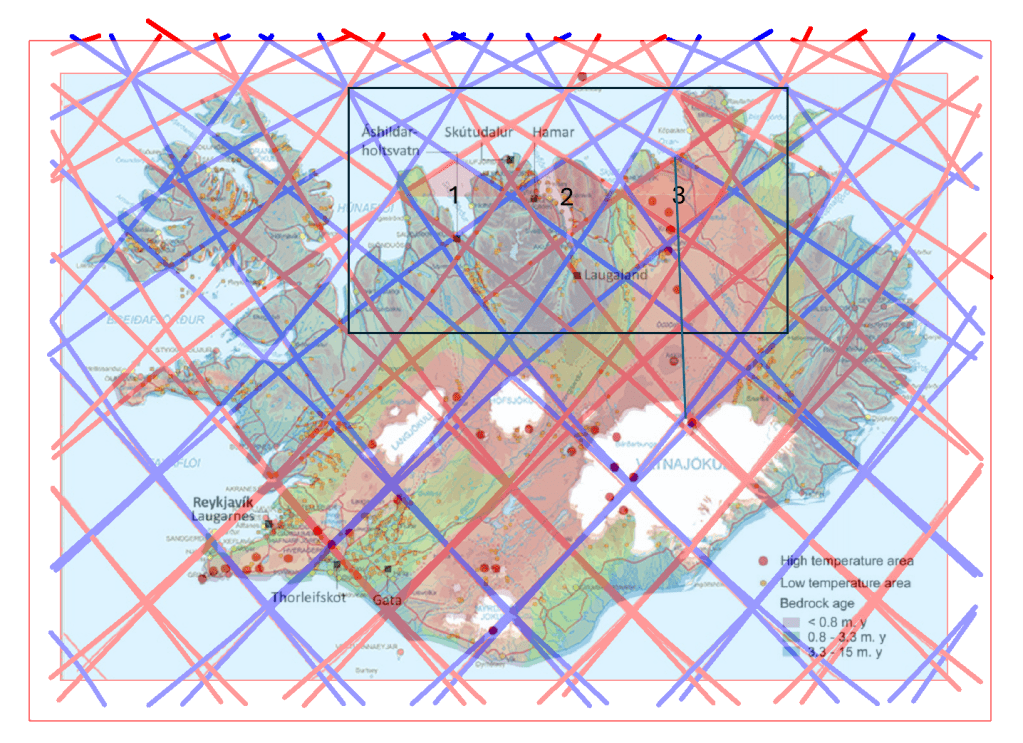
The geothermal activity of central North Iceland can be divided into three main sections: Skagafjörður, Eyjafjörður, and the Mývatn region. Skagafjörður was an active and distinct volcanic zone until a few hundred thousand years ago, after which the main rifting and volcanic activity gradually shifted eastward.
The distribution of geothermal activity in central parts of Norht Iceland
Eyjafjörður, however, remains an important area of geothermal utilization. Significant activity is found there, particularly in the Hjalteyri geothermal field, which produces around 110 liters per second of hot water. This accounts for roughly 60% of the heating supply for Akureyri, a town of about 20,000 inhabitants and often referred to as the capital of North Iceland. The use of geothermal energy here highlights how Iceland effectively harnesses subsurface heat for sustainable urban development.
Further east lies the Mývatn region, one of the most volcanically active areas in the country, centered around the Krafla volcanic system. This area has experienced numerous eruptions in historical times, including the well-known Krafla Fires in the 18th century and rifting episodes in the late 20th century. The region is characterized by high-temperature geothermal systems, extensive lava fields, pseudocraters, and active fissure swarms.
Geothermal and volcanic activity in this region continues northward beneath the surface, extending all the way to the ocean in Öxarfjörður. This follows the active plate boundary between the North American and Eurasian tectonic plates, part of the Mid-Atlantic Ridge system that crosses Iceland.
Knowing the location of convection rolls of different layers, the geothermal activity can be analyzed in more detail than previously possible. The impact of horizontal drift of the tectonic plates on one hand, and that of vertical effect of ascending magma on the other hand can be studied, and besides that local effect of horizontal flow of magma within particular convection rolls can be taken into account. Understanding those three main factors, geology becomes much more understandable.
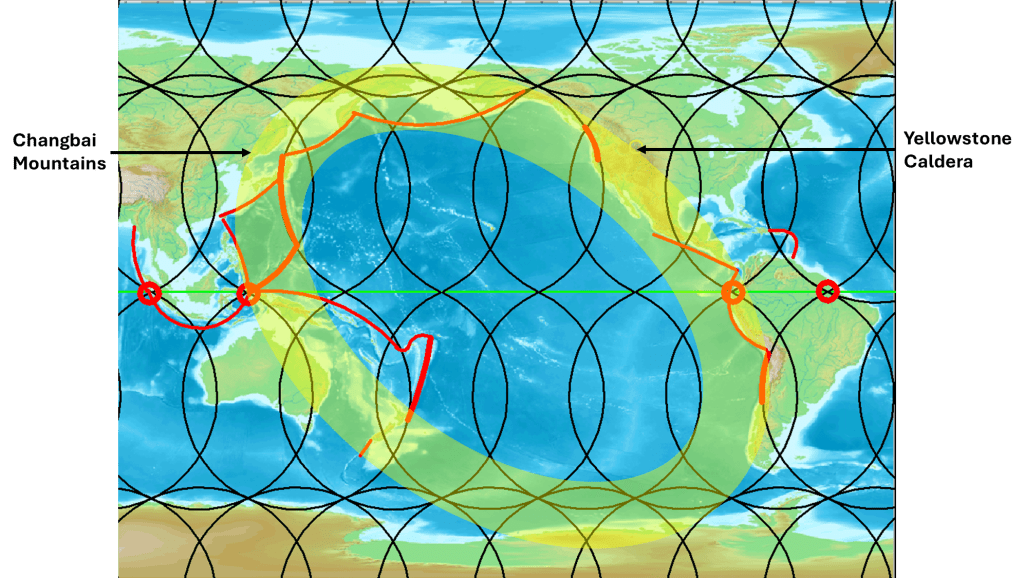
At first glance, the Yellowstone hotspot and the Changbai Mountains seem to lie far outside the familiar boundaries of the Ring of Fire. They are usually treated as exceptions, features belonging to entirely different systems. But what if they are not exceptions at all? What if they are clues? See: https://www.youtube.com/watch?v=3C2HVOB-g5s
Ring of Fire – geometrical shape with Changbai Volcano and Yellowtone Caldera pointed out.
A geometrical starting point
Trying to define a strict geometrical shape for the Ring of Fire may seem futile. Still, it is worth attempting, not as a final answer, but as a way of revealing structure. A useful starting point is to consider two major anchor regions roughly 150° apart along the equator: the subduction zones along Indonesia and those along the west coast of South America. These are not arbitrary points; they represent fundamental expressions of how the Pacific Plate interacts with its surroundings.
From here, an elliptical form can be traced around the Pacific basin. It is basically a perfect ellipse. The Earth is rotating, and the Coriolis effect acts in opposite directions in the two hemispheres. The result is a systematic distortion: the structure is skewed westward in the Northern Hemisphere and eastward in the Southern Hemisphere.
Why the Ring is not a ring
This distortion helps explain something that has long puzzled geologists: the Ring of Fire is not actually a closed ring. It resembles a horseshoe.
One key reason lies in the western Pacific. Subduction zones there, particularly the Tonga–Kermadec system, do not simply trace the outer boundary. Instead, they appear within it, as if mirrored inward. This is consistent with a rotating system where structures are not just arranged spatially, but dynamically shaped. The “ring” is therefore not a rigid boundary. It is the visible expression of a deeper, moving system.
Extending the pattern
If this geometrical framework has any validity, it should not stop neatly at the edges of the Pacific. And indeed, it does not. Volcanic regions in Antarctica can be fitted into the same broad pattern. This alone suggests that we are not dealing with a local phenomenon, but with something that reflects global-scale mantle behavior. And this is where the two outposts come back into focus.
Rethinking Changbai
The Changbai Mountains have long been considered outside the Ring of Fire. Yet seismic evidence shows that material from the Pacific Plate has descended into the mantle transition zone (410–660 km depth) and then spread laterally beneath northeastern Asia. In other words, the influence of Pacific subduction does not stop at the trench. It continues far beneath the surface, so therefore Changbai is not disconnected. It is linked, but in a way that is not immediately visible from above.
Yellowstone as a counterpart
On the opposite side, Yellowstone sits deep within the North American continent. It is typically explained as a mantle plume, rising independently from great depth. But its position relative to the broader geometry is striking. If we extend the distorted elliptical framework, Yellowstone lies close to its outer margin, mirroring Changbai on the other side of the Pacific system.
Beyond the outline
So what lies behind the geometry? The Ring of Fire, when viewed not as a boundary but as a pattern, appears to outline something larger: a system of long, connected mantle flows encircling the Pacific. Subduction zones are only the surface expression of this system. The deeper structure may extend far beyond them, both laterally and vertically.
In that context, Yellowstone and Changbai are not anomalies. They are signals. They suggest that the system does not end at the edges we draw on maps. It continues beneath them. And that may be where the real structure lies.