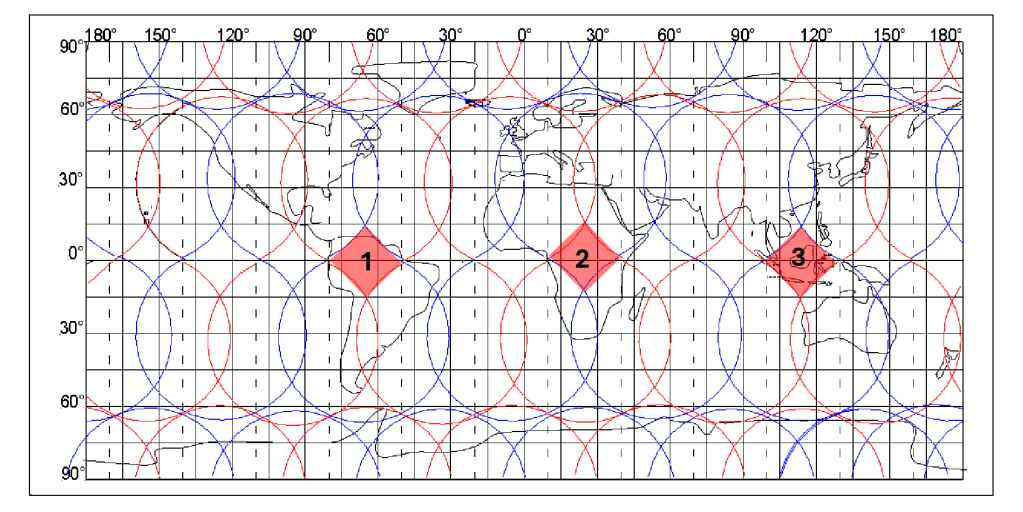
Comparing the three equatorial landmasses of South America, Africa, and Indonesia, we should consider the geometry of these regions and the geological features that immediately stand out on a global map.
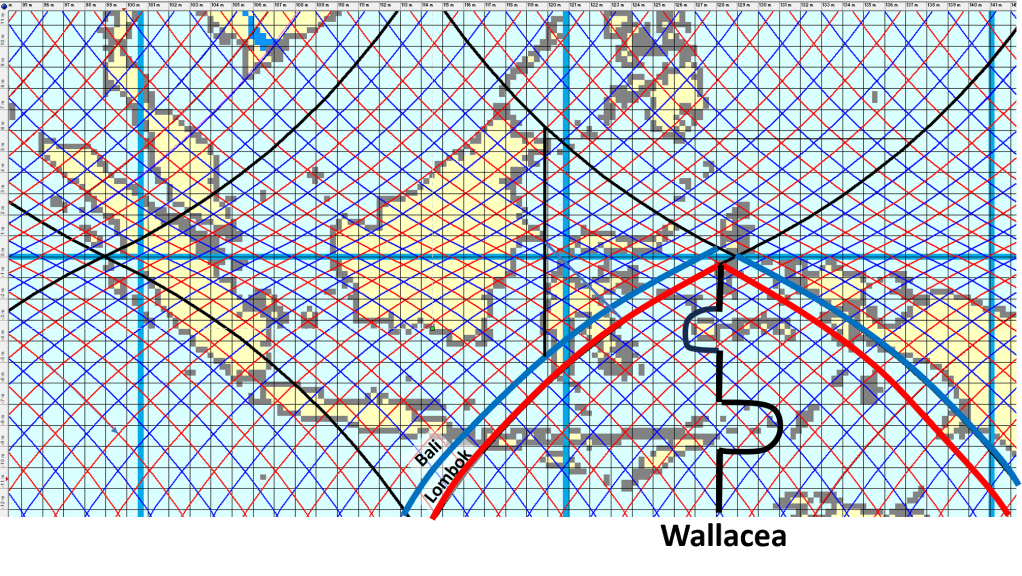
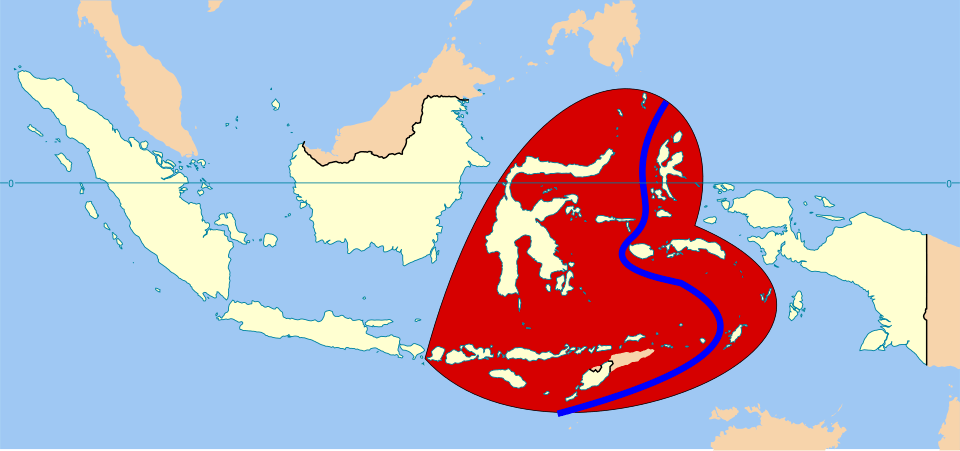
Starting with South America, the enormous Peru–Chile Trench forms the westernmost tectonic boundary of the continent. To the north lies the Caribbean region, partly encircled by another major subduction system. The easternmost point of this equatorial landmass is represented by the Amazon Estuary. The next diamond-shaped equatorial landmass, Africa, is located roughly 60° farther east. Its western margin lies along the Atlantic coast of Africa, while its eastern corner corresponds to the region of the Great Rift Valley, one of the most tectonically active continental structures on Earth. Looking farther east toward Indonesia, the western boundary lies near Sumatra, close to the site of the enormous eruption about 74,000 years ago, commonly associated with the largest caldera in the world of Lake Toba, which some researchers suggest almost wiped out early human populations. The eastern margin of this equatorial region lies within what is probably the most geologically complex area in the world, where multiple tectonic plates, island arcs, microcontinents, and subduction systems interact.
This regularity, both in the geometry of the landmasses and in the distribution of major geological structures, is intriguing. It corresponds remarkably well with the pattern predicted by modeled mantle convection rolls, based on laboratory studies showing that mantle material naturally tends to organize into elongated convection structures under conditions that can logically be expected within Earth’s interior.
From the perspective of the scientific method, this represents a prediction-and-observation type of correspondence. The large-scale surface geometry and tectonic structures visible on world maps are objective features that can be examined directly. The additional step taken here is to propose an explanation for why this pattern may have emerged. Laboratory experiments, the known layered structure of Earth, and mapped geological surface features can, in this interpretation, be viewed as parts of a single coherent framework. Within that framework, Iceland also fits naturally into the larger pattern, positioned between the equatorial regions of South America and Africa along the Mid-Atlantic Ridge. No advanced mathematics are required to recognize the broad geometric relationships visible on a world map. The spatial arrangement itself already suggests a striking degree of large-scale organization.
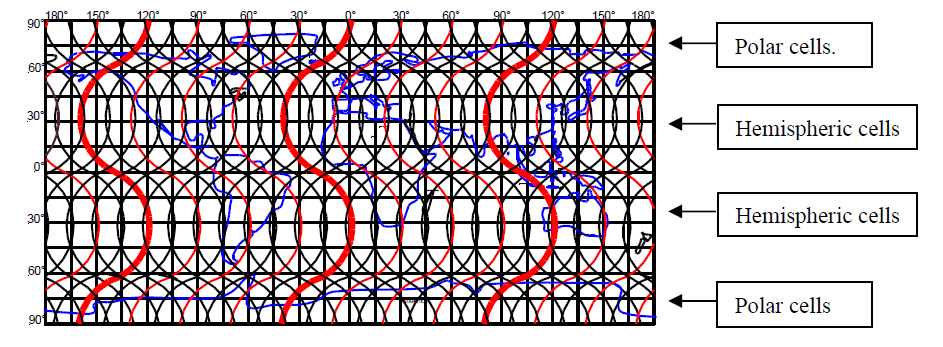
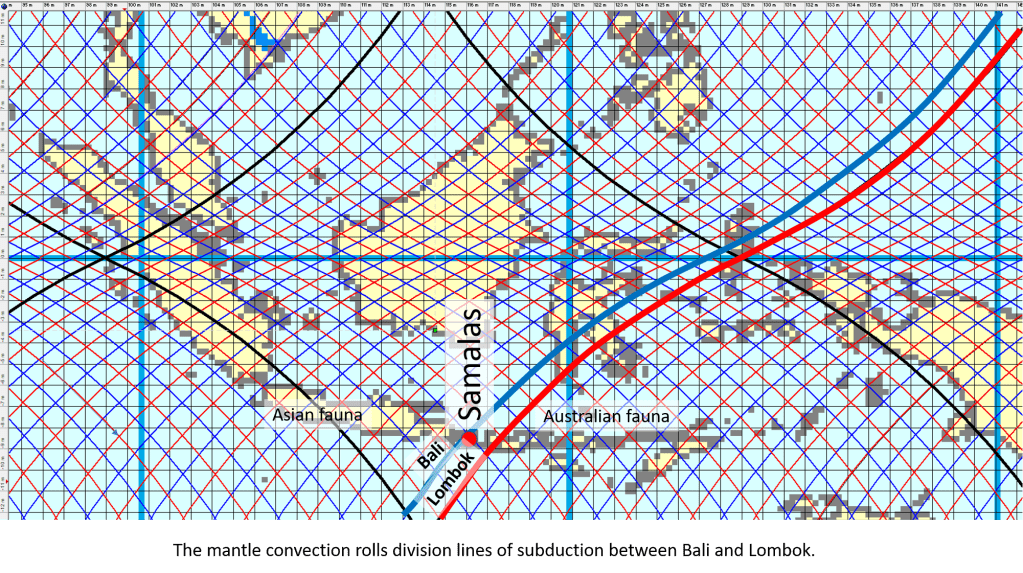
The global pattern of the mantle convection roll system can be examined in many different ways. Focusing on the distribution of landmasses along the equator is particularly revealing, but the pattern also appears in other large-scale geological alignments. When tracing the regularity of the division lines, resembling those observed in Iceland, one can see that Hawaii is connected to the system farther west, while Indonesia aligns with the system farther east. These are observations on a planetary scale. Yet when the same framework is examined in greater detail, for example in Iceland, it also appears capable of explaining aspects of local geology.
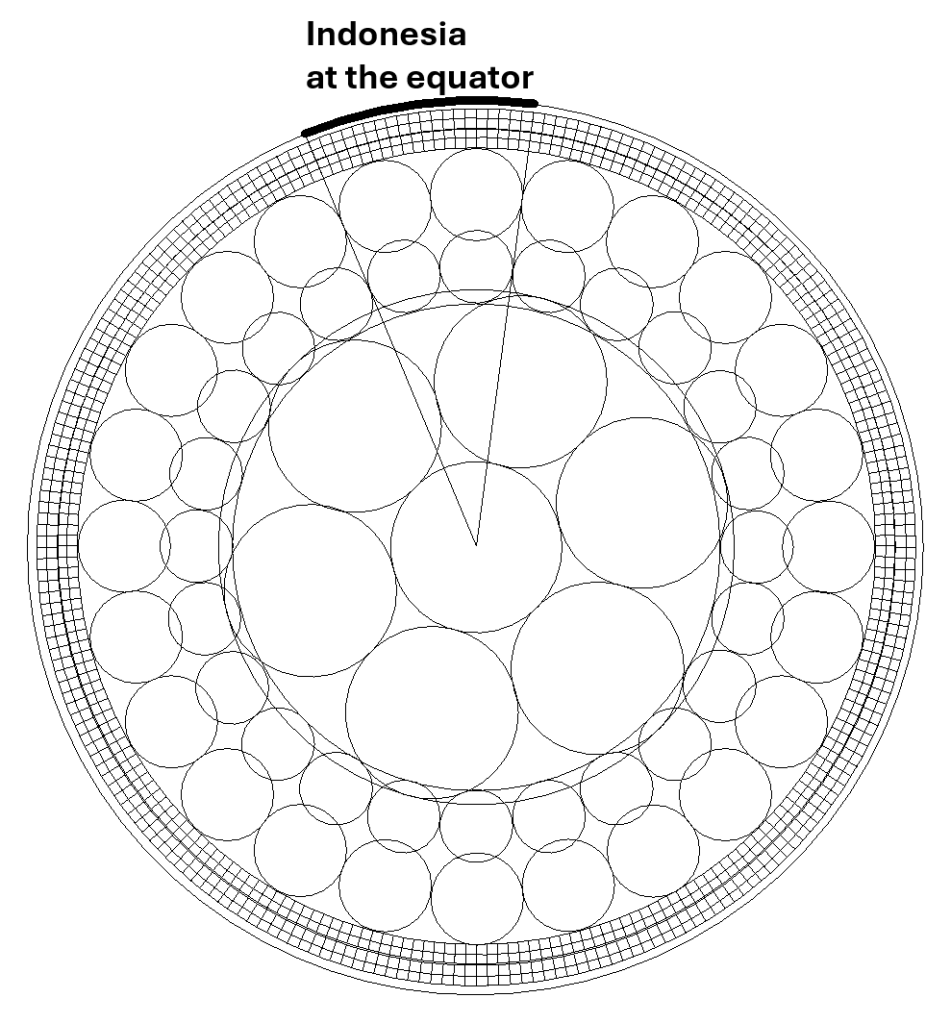
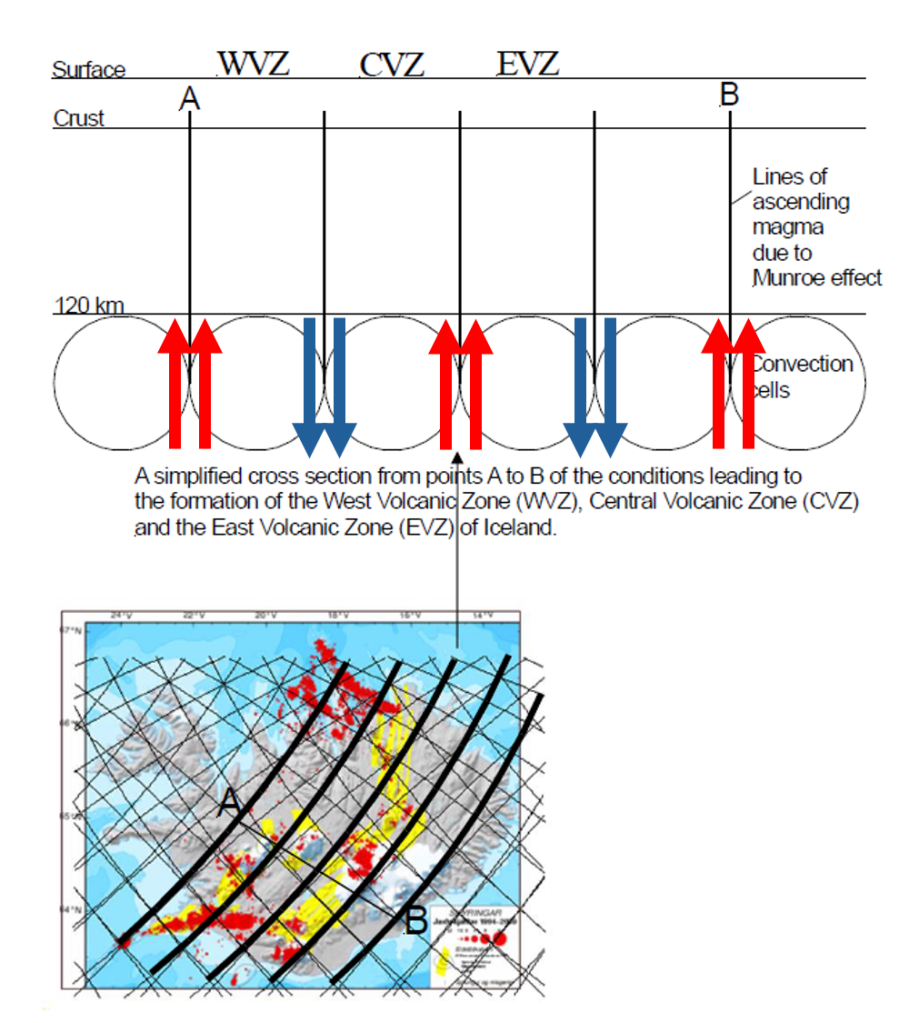
The mantle convection rolls model is theoretical and is based primarily on seismic measurements from around the world, which reveal the layered internal structure of Earth. Nevertheless, the model becomes significant because its explanatory value extends far beyond what might initially be expected. Within this framework, the large-scale structure of the mantle can be anticipated by inserting convection rolls into the known layers of Earth’s interior. Because mantle motion is extremely slow, and no oscillation takes place, the horizontal alignment of the rolls can be calculated very accurately. In this interpretation, the geometry is controlled by convection itself, the spherical shape of Earth, and the fact that the planet rotates.
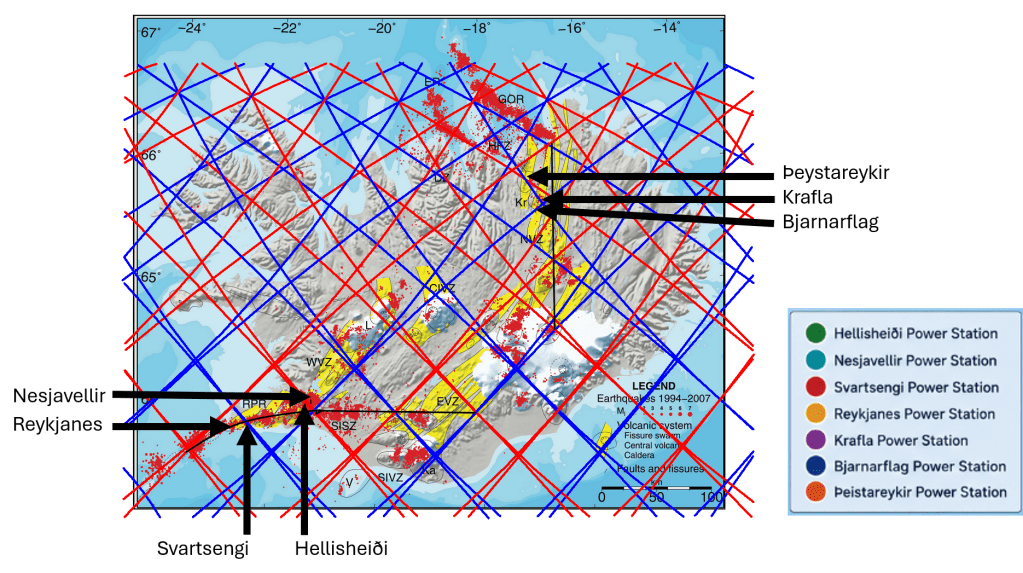
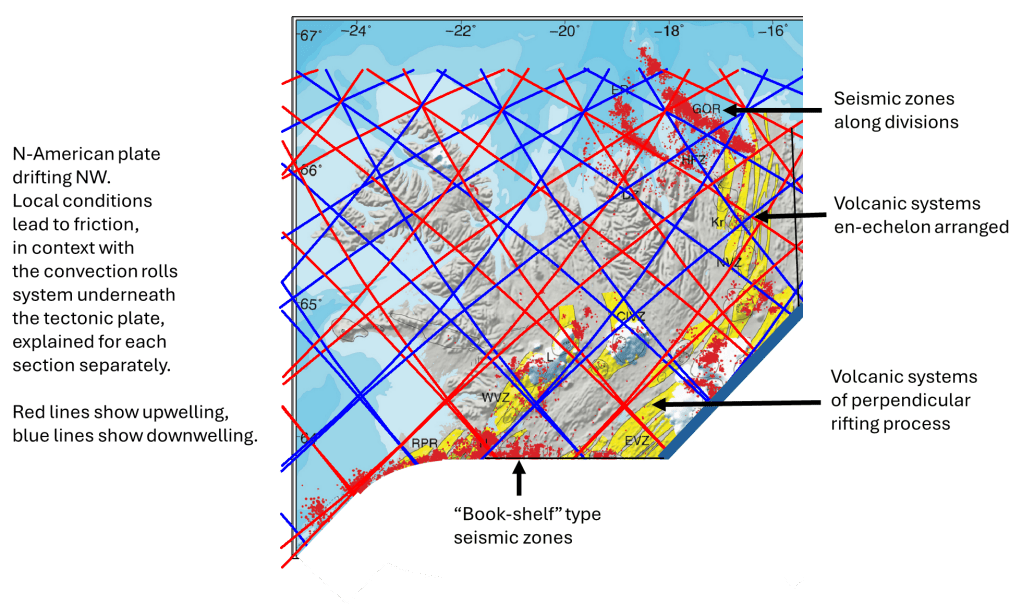
The proposed alignment of the convection rolls can then be compared with observable geological features at the surface. According to this interpretation, the boundary lines become identifiable in many locations around the world through tectonic, volcanic, geothermal, and topographic patterns. From this perspective, Iceland becomes especially important because it provides a relatively accessible surface expression of processes that may otherwise be difficult to recognize at a global scale. The combination of active rifting, volcanism, seismicity, geothermal systems, and clear tectonic boundaries allows the larger mantle framework to be examined in unusually fine detail.