Uncategorized

Framing the Philippine Sea Plate

The Philippine Sea Plate is one of the smaller major tectonic plates of the Earth. It is surrounded by a complex system of plate boundaries and microplates, but in broad terms it occupies the region between the Eurasian Plate to the west, the Pacific Plate to the east, and the Australian Plate to the south.

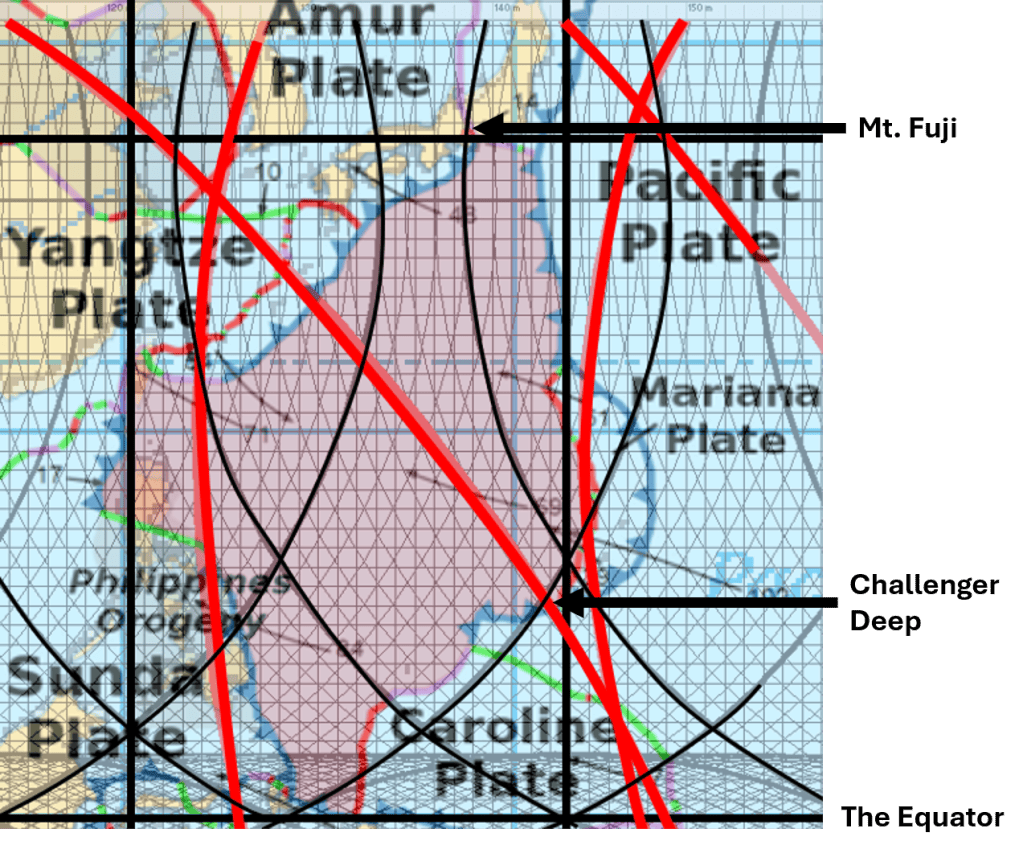
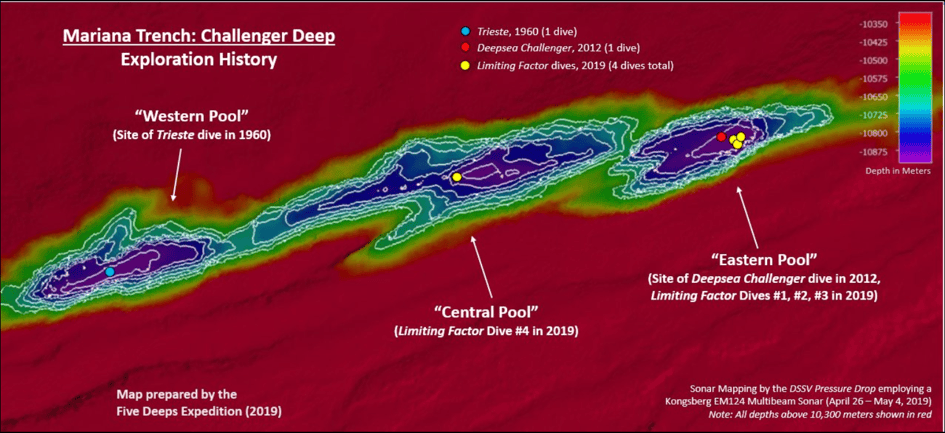
Location of Cahallenger Deep and Fuji pointed out.

When the geometry of the Pacific Ring of Fire is analysed within the convection-roll model, an additional spatial framework emerges. The tectonically active margins surrounding the Pacific appear, in this model, to be largely confined within zones corresponding to the influence of convection-roll systems 15° wide on either side of the Pacific basin, of approxiamately 19.5°.

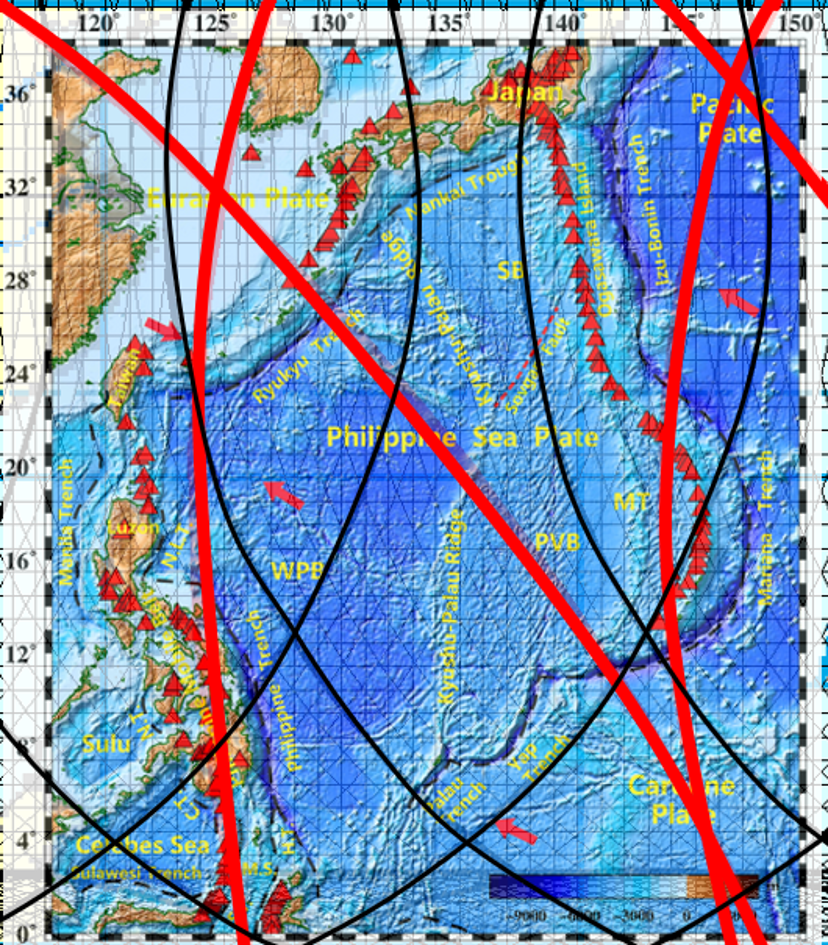
The volcanic areas.

This produces a regular geometrical framework defined by elliptical forms. The principal Pacific ellipse is centred at approximately 6°S, 150.7°E and is rotated by about 45° when plotted on an equidistant rectangular map. Its geometry is related to a larger elliptical system extending toward the South Pole. Two corresponding elliptical systems can then be positioned at intervals of 120° in longitude, producing three major tectonic-ring frameworks around the Earth.

The geometry is constrained by fixed parameters. In the coordinate system used here, the inner ellipse has a minor semiaxis of 51.8 units and a major semiaxis of 77.7 units, whereas the outer ellipse has corresponding values of 71.0 and 96.5 units. Once these parameters, centres, and orientations have been fixed independently, the resulting framework can be compared with observed geological structures without further adjustment.

The Philippine Sea Plate at the Intersection of Two Tectonic Rings

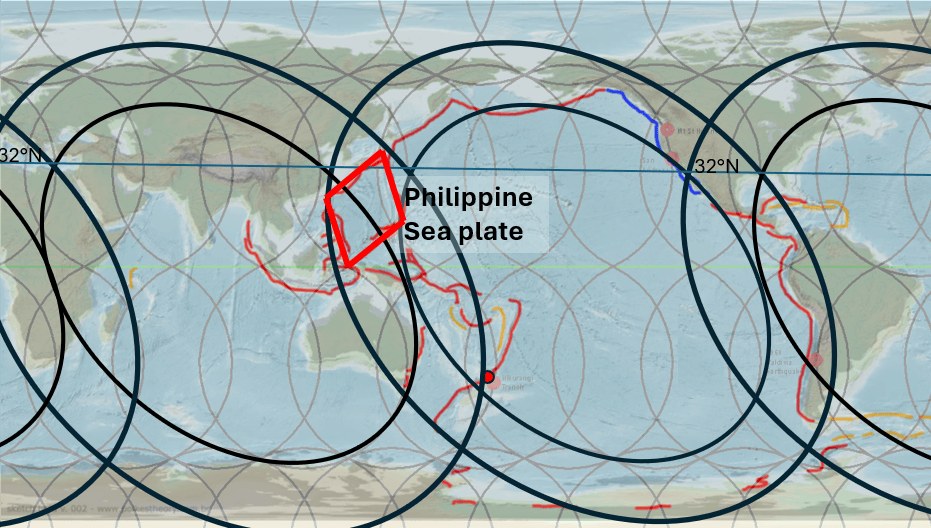
One particularly interesting comparison concerns the Philippine Sea Plate. Within this geometrical framework, the plate occupies the intersection between the Pacific tectonic ring (the Ring of Fire) and the neighbouring tectonic ring associated with the Indian Ocean.

The basic shape and location of the Philippine Sea Plate.

The Philippine Sea Plate fits remarkably regularly within this intersection zone. In simplified geometrical form, it can be represented as a diamond-shaped region whose southern apex approaches the Equator. Its eastern and western margins broadly follow the structural directions generated by the intersecting ring systems, while its northern termination lies within the complex tectonic region of Japan.

Several individual features provide useful reference points for testing the geometry. The inner margin of the Indian Ocean tectonic ring reaches the Mariana–Philippine Sea boundary close to the Challenger Deep, the deepest known point in the world’s oceans. This is situated along the boundary between the Philippine Sea Plate and the Pacific Plate. Farther north, Mount Fuji lies close to one of the principal convection-division lines defined by the model.

The geometry also highlights the possible structural significance of particular latitudes. The Equator forms an important southern reference line, while approximately 32°N provides a northern geometrical boundary within the model. Much of the Philippine Sea Plate is therefore contained between these two latitude controls.

A second regularity appears in longitude. North–south axes can be defined at intervals related to the 15° convection-roll spacing, together with an additional half-spacing of 7.5°. This gives a characteristic east–west interval of approximately 22.5°, comparable with the longitudinal width of the plate and its surrounding tectonic system.

A Geometrically Constrained Plate

The significance of the Philippine Sea Plate in this analysis is therefore not based on a single point of correspondence. Several independent geometrical elements can be compared simultaneously: the Equator, the 32°N latitude, the north–south convection divisions, the margins of the two intersecting tectonic rings, the position of the Mariana Trench and Challenger Deep, and the northern tectonic junction near Japan.

Fuji and Challenger Deep.

Taken together, these relationships make the Philippine Sea Plate a particularly useful area for testing the tectonic-ring model. Instead of appearing as an irregular plate whose shape is considered only in relation to its immediate neighbouring plates, it can be examined as a structure occupying a geometrically defined intersection between two larger-scale tectonic systems.

The most striking feature is therefore the overall confinement of the Philippine Sea Plate within the overlapping domains of the Pacific and Indian Ocean tectonic rings. If this correspondence remains consistent when tested against independently mapped plate boundaries, trenches, volcanic arcs, and seismic zones, the Philippine Sea region may provide one of the clearest examples for evaluating the proposed global convection-roll framework.

Further reading: https://pangea.stanford.edu/ERE/db/GeoConf/papers/SGW/2024/Thorbjarnarson.pdf

Challenger Deep: A Convergence of Geometrical and Tectonic Features

A particularly significant location within this framework is the Challenger Deep, because several of the geometrical relationships investigated in this study converge within a very small area. Challenger Deep is located near 11°22′N, 142°30′E, at the southern end of the Mariana Trench. Modern measurements place its greatest depth at approximately 10,935 ± 6 m below mean sea level, making it the deepest reliably measured point in the world’s oceans.

In conventional plate-tectonic terms, Challenger Deep forms part of the Izu–Bonin–Mariana subduction system. Along this system, the Pacific Plate descends westward beneath the plate system forming the eastern margin of the Philippine Sea region. At the southern Mariana Trench, the immediate overriding plate is the Mariana microplate, separated farther west from the main Philippine Sea Plate by the Mariana Trough. Thus, Challenger Deep occupies a highly distinctive position along the eastern tectonic boundary of the broader Philippine Sea Plate system.

Within the convection-roll and tectonic-ring model presented here, however, the location acquires an additional geometrical significance.

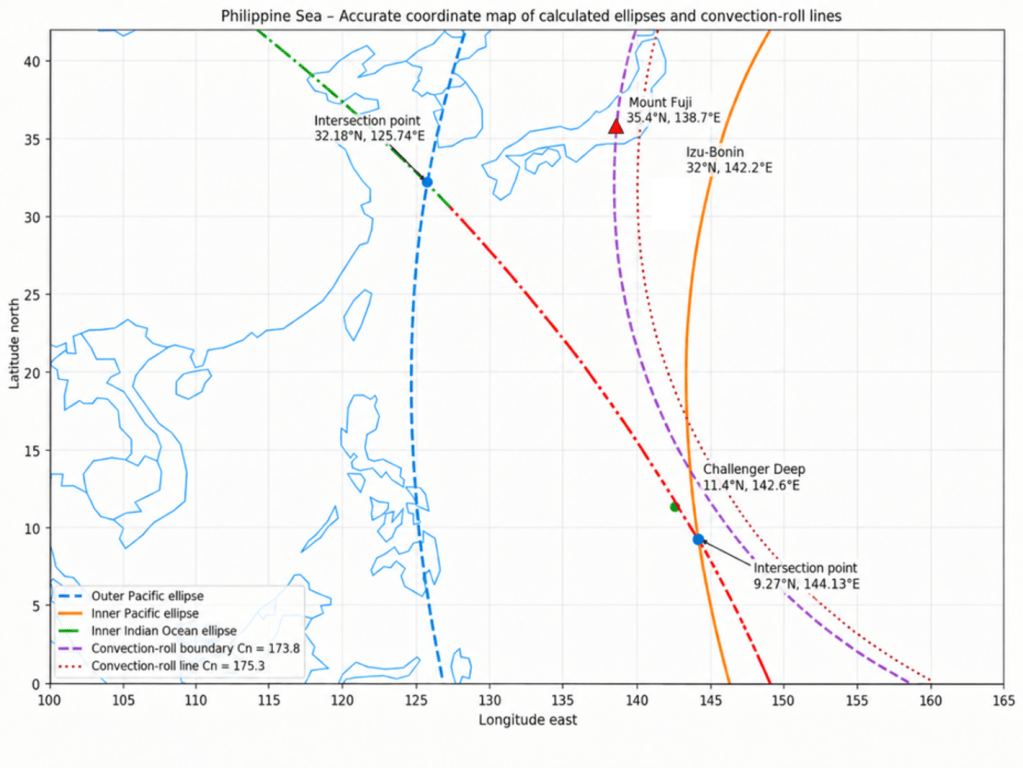
The eastward-bending convection roll centred at approximately 113.8°E, with its geometry referenced to 32°N and a radius of 35.341 model units, intersects the inner elliptical margin of the Indian Ocean tectonic ring almost exactly in the Challenger Deep region. The Indian Ocean ring is defined here by a centre at approximately 90.7°E, 6°S, with an inner ellipse having semiaxes of 51.8 and 77.7 model units and an orientation of approximately 45° NW–SE.

Because these geometrical parameters are established independently of the position of Challenger Deep, the correspondence provides a useful test of the proposed framework rather than a geometrical construction fitted specifically to the trench.

A second convection-roll structure also approaches this location. The westward-bending roll centred at approximately 173.8°E, which passes beneath the Fuji region farther north, intersects the 113.8°E roll system only about 2° of map distance from Challenger Deep. The proximity of this lower-mantle roll intersection to the deepest part of the Mariana Trench is therefore another feature that can be tested against the model.

These roll intersections are also associated in the model with major north–south structural axes. Comparable axes can be traced northward from Antarctica, and one of these axes closely follows the eastern side of the Philippine Sea Plate system. Challenger Deep consequently lies close not only to a plate boundary and an elliptical ring margin, but also to one of the principal N–S divisions generated by the convection-roll geometry.

A fourth geometrical element occurs immediately to the east. The inner margin of the Pacific tectonic ring (the Ring of Fire) lies only about 3° east of Challenger Deep. Southeast of the Challenger Deep region, this Pacific-ring margin approaches and eventually intersects the inner margin of the Indian Ocean tectonic ring. Challenger Deep is therefore situated close to the area where the influence zones of two independently defined tectonic rings converge.

The location can consequently be described in terms of several superimposed geometrical controls:

  • the active Pacific–Mariana subduction boundary;
  • the inner margin of the Indian Ocean tectonic ring;
  • the nearby inner margin of the Pacific Ring of Fire;
  • the intersection of two convection-roll systems;
  • and a major N–S structural axis associated with the convection-roll framework.

The morphology of Challenger Deep itself may also be relevant. Rather than forming one simple linear depression, its deepest region consists of several elongated depressions arranged in a broadly right-stepping en echelon pattern. Such segmentation suggests that the morphology of the trench cannot necessarily be described solely in terms of motion perpendicular to the subduction boundary. Along-strike deformation, oblique stresses, inherited structures, and deformation within the overriding and subducting plates may also contribute to its detailed form.

The Cahllenger Deep.

Within the model proposed here, this geometry raises an additional possibility. The Mariana subduction system represents the dominant conventional tectonic process operating at the site, while the elliptical tectonic-ring boundaries describe predominantly horizontal, large-scale geometrical controls. The convection-roll divisions, in contrast, represent vertically organised mantle circulation expressed at the surface through their predicted boundaries and intersection zones.

Challenger Deep may therefore represent an especially useful location for examining the proposed interaction between these two components: horizontal tectonic organisation associated with the elliptical ring system and vertically organised mantle circulation associated with the convection rolls. Their spatial coincidence with an active subduction zone could help explain why this particular part of the plate boundary has developed such an exceptional and strongly segmented morphology.

This does not by itself demonstrate a causal relationship between the geometrical framework and the exceptional depth of Challenger Deep. It does, however, provide a particularly well-constrained location at which several independently derived elements of the model can be compared directly with observed bathymetry, plate boundaries, seismicity, and subduction geometry.

According to the present model, Challenger Deep is located at a point where two independently defined structural controls coincide. The inner margin of the tectonic ellipse passes through the area, while a convection-roll division derived from a different part of the model also intersects the same locality. Their orientations are therefore not merely spatially close; they form a superimposed geometrical framework at the site.

This suggests that several tectonic components may be acting together. The Mariana subduction system provides the dominant convergent setting, while the regional oblique plate motion introduces a significant strike-slip component. Superimposed on this, the model places both an elliptical tectonic boundary and a convection-roll division through the Challenger Deep region. The morphology of the deep may therefore reflect the combined influence of convergence, lateral shear, and the interaction of these two larger-scale structural controls.

In this interpretation, Challenger Deep becomes especially significant because the different elements are derived independently. The elliptical geometry is defined by the tectonic-ring framework, whereas the convection-roll directions are determined by the mantle-roll system. Their intersection at the same location, together with the observed trench and strike-slip geometry, provides a particularly useful site for testing whether these proposed controls are reflected in the actual structure of the plate boundary.

Uncategorized

The Red Sea and the Gulf of California: Two Comparable Rift Systems

According to the tectonic-ring model associated with the mantle convection-roll system, the Red Sea and the Gulf of California occupy remarkably similar geometrical positions.

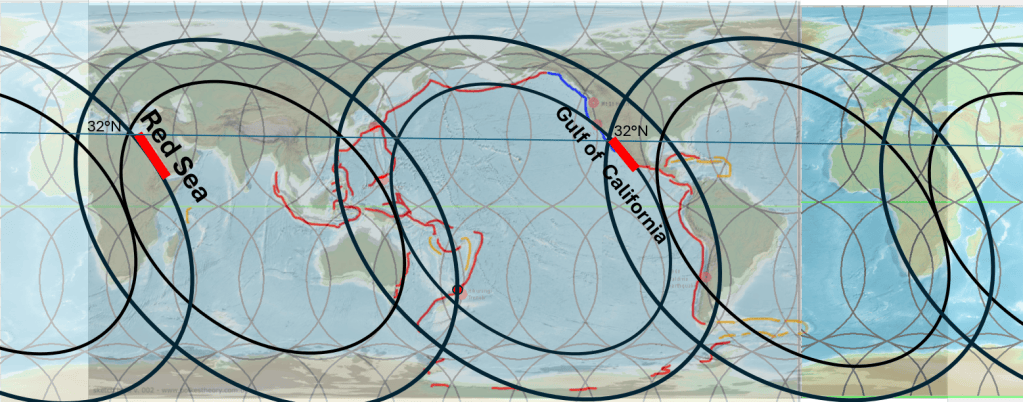
The position of Red Sea and Gulf of California as compared with the scope of the Ring of Fire
and the other theoretical tectonic rings of the Atlantic and Indian oceans.

Both form elongated zones of crustal extension situated along the margins of large tectonic rings, although they occur on opposite sides of the global system.

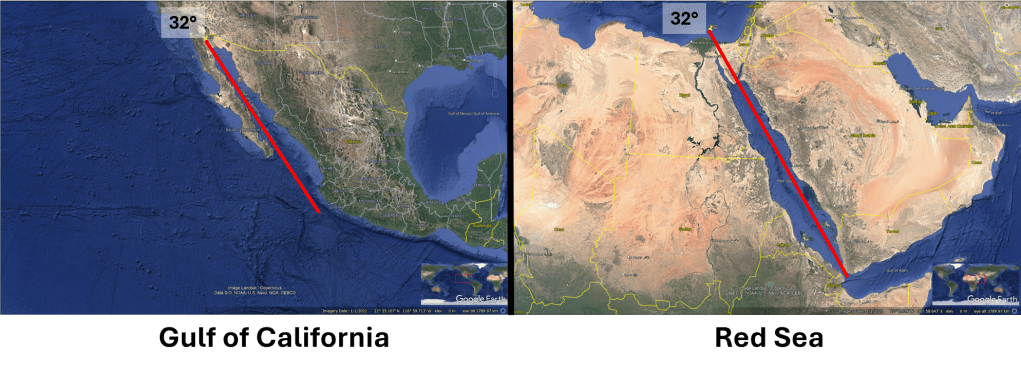
Gulf of California and the Red Sea compared.

The Red Sea

In the model, the Red Sea is situated along the outer periphery of the Atlantic tectonic ring, which is theoretically derived as the counterpart of the Pacific Ring of Fire. Its elongated form follows the curvature of the corresponding elliptical boundary.

On the map, 32°N latitude is shown as a reference line and marks the northern limit of the section highlighted in red. From there, the tectonically active zone extends southward toward the Afar region, where the Red Sea system connects with the Gulf of Aden and the East African Rift.

The Gulf of California

The Gulf of California occupies a comparable position along the inner periphery of the Pacific tectonic ring, or Ring of Fire. As in the Red Sea, the elongated tectonic zone approximately follows the geometry of the relevant elliptical boundary.

Again, 32°N latitude is shown as a reference, allowing the geographical positions of the two systems to be compared directly. The Gulf of California extends southward from approximately this latitude and forms part of the active boundary between the Pacific and North American plates.

A striking geometrical comparison

Comparison of the two regions reveals several noteworthy similarities:

  • Both form long, narrow tectonic basins produced by crustal extension.
  • Both are associated with active plate separation and magmatism.
  • Both occupy marginal positions within the proposed tectonic-ring geometry. The Red Sea follows the outer boundary of the Atlantic ring, whereas the Gulf of California follows the inner boundary of the Pacific ring.
  • The highlighted sections occupy broadly comparable latitude ranges and can therefore be compared directly using the 32°N reference line.
  • Both systems developed mainly during the Cenozoic and underwent major tectonic reorganization during the Miocene and later.
  • In both cases, extension is not expressed as a single simple fracture. Instead, deformation is distributed through rift basins, faults, volcanic zones, and, in more developed sections, spreading centres.

The similarity is particularly interesting because the two systems belong to different conventional plate-tectonic settings. The Red Sea records the separation of Arabia from Africa, whereas the Gulf of California forms part of the Pacific–North America plate boundary. Nevertheless, when viewed within the tectonic-ring framework, both occupy equivalent geometrical positions along major elliptical boundaries. The precondition of this comparison is of course at first to analyse the form of the Ring of Fire, and the to transfer that analysis to the Atlantic Ocean.

Possible significance

The comparison therefore raises an important question: can the similar geometry of the Red Sea and the Gulf of California be explained solely by their individual plate-tectonic histories, or does their position within a larger global geometrical system also play a role?

Within the convection-roll model, the resemblance is not regarded as accidental. The two regions can be interpreted as corresponding expressions of extension along the boundaries of two different tectonic rings: one on the outer side of the Atlantic ring and the other on the inner side of the Pacific ring.

Their similar elongated forms, broadly comparable latitudinal positions, young geological development, and relationship to active extension make the Red Sea–Gulf of California comparison a useful test case for examining the proposed connection between mantle convection rolls and the large-scale geometry of plate boundaries.

Uncategorized

A 30° Equatorial Sequence of Major Tectonic and Geographic Features

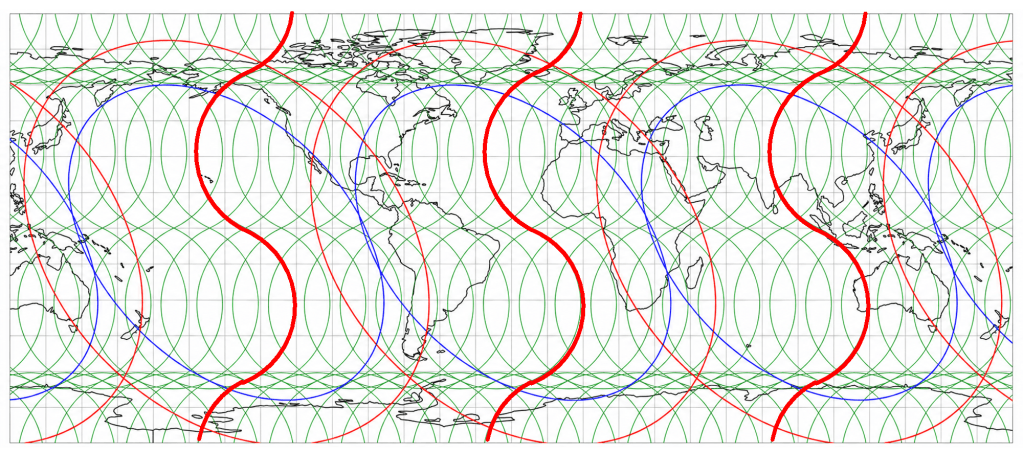
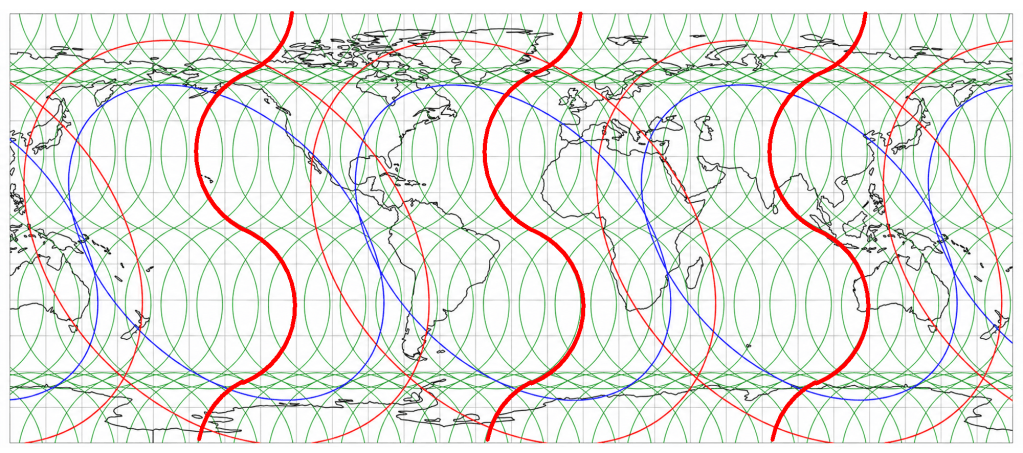
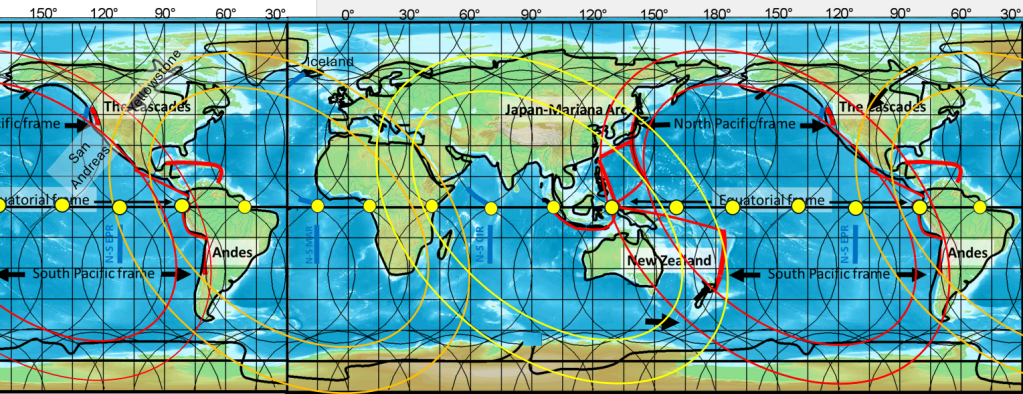
30° stepstones along the equator (yellow dots).

A particularly striking feature of the proposed mantle-convection framework is a regular sequence of principal lower-mantle divisions along the equator. Taking 21.16°W as the theoretical reference longitude beneath the central Atlantic, equivalent divisions occur at intervals of exactly 30°. Moving eastward around the Earth, the relevant sequence considered here is:

  1. 111.16°W — East Pacific Rise
  2. 81.16°W — western margin of South America
  3. 51.16°W — Amazon mouth and northeastern South America
  4. 21.16°W — central Atlantic / Mid-Atlantic Ridge
  5. 8.84°E — western coast of equatorial Africa
  6. 38.84°E — East African Rift region
  7. 68.84°E — Central Indian Ridge
  8. 98.84°E — western margin of Indonesia
  9. 128.84°E — eastern Indonesia
  10. 158.84°E — possible additional boundary east of Papua New Guinea

These are theoretical longitudes. The model does not require the principal surface expression to occur precisely on each lower-mantle division. Upper-mantle upwelling lines occur approximately 1.5° to either side, while the effects of the adjacent convection roll may be expressed as much as 3° from the principal division. The appropriate comparison is therefore with a narrow longitudinal belt rather than with a geometrically infinitesimal line.

1. 111.16°W — East Pacific Rise

The first point lies in the eastern Pacific and corresponds closely to the East Pacific Rise, one of the Earth’s major oceanic spreading systems. Around the equatorial and southeastern Pacific, the East Pacific Rise occupies approximately the 110°W region, although its longitude varies with latitude. The theoretical longitude of 111.16°W therefore falls within about one degree of the broad ridge system. Studies of the eastern tropical Pacific commonly place the Rise near 110°W, while the EPR can be followed continuously southward from the equatorial region.

This is an important starting point because here the expected mantle division is expressed by an unmistakable oceanic spreading system. In the convection-roll interpretation, the surface ridge need not coincide exactly with the lower-mantle division; displacement toward an adjacent upper-mantle upwelling line would be expected.

2. 81.16°W — the western margin of South America

Thirty degrees farther east gives 81.16°W. At the equator this lies immediately west of the coast of Ecuador. Ecuador itself straddles the equator and its western boundary is the Pacific continental margin.

This is a fundamentally different tectonic environment from the East Pacific Rise. Instead of oceanic spreading, the eastern Pacific basin terminates against the South American margin, where the Nazca Plate converges with South America. Thus, within one 30° interval, the system passes from a major zone of crustal production to the continental margin toward which that oceanic plate moves.

The correspondence should not be interpreted as a claim that 81.16°W itself is the trench axis. Rather, it marks the equatorial longitude of the broader western South American tectonic boundary zone.

3. 51.16°W — the mouth of the Amazon

The next theoretical division, 51.16°W, reaches the opposite side of South America near the great outlet of the Amazon River.

This point is different from most of the others because the dominant surface expression is not an active plate boundary. Nevertheless, the Amazon mouth marks one of the major geological and physiographic transitions on Earth: the enormous Amazon drainage system reaches the Atlantic margin here. NASA describes the Amazon as carrying the largest freshwater discharge of any river, delivering roughly one fifth of global river discharge to the oceans.

Within the proposed framework, the significance would therefore not necessarily be present-day faulting. The question is whether the continental-scale drainage architecture, sedimentary basin and Atlantic continental margin preserve a longer-term structural influence associated with the same regular mantle division.

This point consequently needs to be treated more cautiously than the active ridges and rifts.

4. 21.16°W — the central Atlantic

Another 30° east brings the sequence to its reference point, 21.16°W.

This correspondence is particularly close. The Mid-Atlantic Ridge crosses the equatorial Atlantic in the vicinity of 21–22°W. For example, a large 2022 earthquake classified by the USGS as occurring on the central Mid-Atlantic Ridge was located at 0.934°S, 21.716°W. The theoretical value of 21.16°W is therefore within roughly half a degree of this active ridge position.

In the model, this longitude represents a principal lower-mantle division, while the actual surface spreading system may occupy the adjacent 1.5° roll positions. This distinction is important: the geometric reference is defined at depth, while the observable ridge records the response of the upper mantle and lithosphere.

5. 8.84°E — western equatorial Africa

The next 30° step gives 8.84°E, which reaches the Atlantic coast of equatorial Africa near Gabon. Independent geographical data place the equatorial portion of Gabon between approximately 9°E and 14°E, making 8.84°E essentially a coastal or immediately offshore position. Thus the 30° sequence produces another striking basin-scale relationship:

South American Atlantic margin → Mid-Atlantic Ridge → African Atlantic margin, at intervals of approximately 30°.

This does not mean that the Atlantic basin is geometrically symmetrical in conventional plate-tectonic terms. Rather, it suggests that the theoretical mantle sequence intersects three very different parts of the Atlantic system: one continental margin, the spreading axis, and the opposite continental margin.

6. 38.84°E — the East African Rift region

The next theoretical lower-mantle division is 38.84°E. Here the distinction between the lower-mantle division and the surface response becomes particularly important. The main Kenya Rift at the equator does not lie at 38.84°E. Its axial region is farther west. Lake Bogoria, for example, lies at approximately 36.05–36.12°E immediately north of the equator, within the central Kenya Rift. However, the model predicts:

38.84°E — principal lower-mantle division
37.34°E — upper-mantle upwelling line
35.84°E — outer influence/downwelling side of the adjacent 1.5° roll

The last value, 35.84°E, falls remarkably close to the active Kenya Rift. The central Kenya Rift itself is a roughly 100-km-wide asymmetric extensional structure in this region.

Seismic and gravity studies along the equator have additionally suggested that the elevated East African plateau requires a regional mantle contribution and is compatible with dynamic support by mantle convection. This makes the African point particularly useful for distinguishing the deep theoretical division from its displaced lithospheric expression.

7. 68.84°E — the Central Indian Ridge

Thirty degrees farther east lies 68.84°E, almost directly on the active ridge system of the central Indian Ocean. The Central Indian Ridge extends northward from the Rodrigues Triple Junction toward the Carlsberg Ridge. Near the equatorial region it lies broadly between 67°E and 69°E. Published ridge-axis locations include approximately 1.19°S, 67.52°E, and farther south several segments occur between about 68.1° and 68.6°E.

The theoretical 68.84°E position therefore falls comfortably within the ±1.5° influence interval and extremely close to the actual spreading system.

Together with the Mid-Atlantic Ridge and East Pacific Rise, this gives the sequence three major oceanic spreading systems separated by intervening continental and tectonic domains.

8. 98.84°E — western Indonesia

At 98.84°E, the sequence reaches the western Indonesian region, close to Sumatra and the Sunda convergent margin.

This is no longer a spreading environment. Southwest of Sumatra, the Indo-Australian plate converges with the Sunda plate along the Sunda–Java trench system. The USGS describes this as part of an immense collision zone extending from the Indonesian region toward the Himalaya and notes the intense seismicity and volcanism produced by the Sumatra–Andaman subduction system.

The theoretical longitude therefore lies near one of the Earth’s major transitions from Indian Ocean lithosphere into the Indonesian convergent system.

9. 128.84°E — eastern Indonesia

Another 30° east gives 128.84°E, in the exceptionally complex tectonic region of eastern Indonesia, close to the Molucca Sea–Halmahera system.

This is one of the most unusual convergent environments on Earth. The Molucca Sea plate has been consumed by oppositely directed subduction beneath the Sangihe and Halmahera arcs, producing an active arc–arc collision. Modern studies describe the Molucca Sea as one of Southeast Asia’s most complicated tectonic regions and document the interaction of the Philippine Sea, Eurasian/Sunda and Australian plate systems.

A USGS regional tectonic map of the central Molucca Islands uses 128°E as its central meridian and shows subduction zones, strike-slip faults, thrusts and volcanic arcs concentrated through this longitude range. Thus the 128.84°E point corresponds not merely to the eastern edge of Indonesia geographically, but to a major zone of tectonic reorganisation.

10. 158.84°E — a possible additional point east of Papua New Guinea

The next step, 158.84°E, is particularly interesting because it lies east of Papua New Guinea in the Woodlark–Solomon region. This point has not yet been incorporated into the principal sequence in the same way as the preceding nine because the geological relationships are much more complicated. Nevertheless, there is clearly major tectonic and magmatic activity within the predicted belt.

The USGS places the Woodlark Basin between approximately 157° and 159.5°E, directly encompassing the theoretical longitude of 158.84°E. The basin contains the boundary between the Solomon Sea and Australian/Woodlark plates and is an active extensional system. Immediately farther east, the Guadalcanal segment of the Solomon plate boundary occupies approximately 159–161°E.

The broader Solomon system combines active seafloor spreading, subduction of young Woodlark lithosphere, microplate motion, intense seismicity and interaction with the Ontong Java Plateau. The USGS tectonic synthesis shows spreading across the Woodlark Ridge and subduction along the Solomon system, while the Solomon arc has experienced very high levels of large-earthquake activity.

The importance of this tenth point is therefore not that a single simple plate boundary lies precisely at 158.84°E. Rather, the predicted 158.84°E ±3° belt coincides with an exceptionally active zone in which spreading, subduction, arc volcanism and microplate deformation interact. For this reason, 158.84°E should probably be retained as a candidate tenth equatorial node, even if its precise geological expression remains unresolved.

The larger pattern

The sequence is noteworthy because the theoretical coordinates are generated independently of the geological features:

111.16°W → 81.16°W → 51.16°W → 21.16°W → 8.84°E → 38.84°E → 68.84°E → 98.84°E → 128.84°E → 158.84°E.

Across these ten consecutive 30° positions one encounters, in order: East Pacific spreading → South American continental margin → Amazon/Atlantic continental margin → Mid-Atlantic spreading → African continental margin → East African rifting → Indian Ocean spreading → Sunda subduction → Molucca arc collision → Woodlark–Solomon spreading/subduction.

The geological processes are therefore not of one type. Some points correspond to spreading ridges, others to continental margins, rifts, subduction systems or complex collision zones. What they potentially have in common is their position relative to a regular deep-mantle framework.

This distinction is central to testing the model. The proposed lower-mantle divisions should not be expected to produce identical structures everywhere. The lithosphere above them differs greatly in age, thickness, composition and pre-existing tectonic architecture. The test is instead whether major changes in tectonic organization occur repeatedly within the predicted ±1.5° to ±3° belts around an independently defined 30° sequence.

The correspondence at 21.16°W, 68.84°E and approximately 111.16°W is particularly interesting because all three are associated with major oceanic spreading systems. The 38.84°E case provides a different and potentially important test: the lower-mantle division itself lies east of the Kenya Rift, while the predicted western influence line at 35.84°E approaches the actual rift axis closely. Eastern Indonesia at 128.84°E and the candidate point at 158.84°E show yet another manifestation, where the regular sequence enters some of the most structurally complicated convergent regions on Earth.

The Papua–Solomon point therefore deserves further investigation rather than premature classification. If 158.84°E ultimately proves to occupy a systematic position within the Woodlark–Solomon tectonic and magmatic system, it would extend an already remarkable 30° equatorial sequence by one further major tectonic node.

The 30° Equatorial Sequence and the ±3° Mantle-Roll Belts

Taking 21.16°W as a principal lower-mantle division, twelve equivalent divisions occur at exact 30° intervals around the equator. In the proposed convection-roll model, the surface expression does not necessarily coincide with the principal lower-mantle longitude. Upper-mantle upwelling occurs approximately 1.5° to either side, while geological effects of the adjacent roll may occur as far as 3° from the principal division.

The 30° Equatorial Sequence (yellow dots on the map)

30° stepstones along the equator (yellow dots).
No.Principal division / beltMain geological correspondenceInterpretation
1111.16°W ±3°East Pacific RiseMajor oceanic spreading system; ridge axis lies within the predicted mantle-roll belt.
281.16°W ±3°Western margin of South AmericaNazca–South America convergence and subduction along the Ecuador–Colombia margin.
351.16°W ±3°Amazon mouth / NE South AmericaMajor continental and sedimentary transition at the Atlantic margin; less directly tectonic than most other points.
421.16°W ±3°Equatorial Mid-Atlantic RidgeMajor spreading system. The ridge/transform system approaches the eastern side of the predicted belt, near 18.16°W.
58.84°E ±3°West coast of equatorial AfricaAtlantic continental margin and inherited structural zone of the Gabon Basin.
638.84°E ±3°East African RiftKenya Rift lies toward the western side of the belt, close to the predicted 35.84°E outer influence line.
768.84°E ±3°Central Indian RidgeMajor Indian Ocean spreading system; the ridge axis falls within the predicted belt.
898.84°E ±3°Western Indonesia / Sunda marginMajor subduction system west of Sumatra, with strong seismic and volcanic activity.
9128.84°E ±3°Eastern Indonesia / Molucca–HalmaheraExceptionally complex arc–arc collision, opposing subduction systems and intense magmatism.
10158.84°E ±3°Woodlark–Solomon regionBroad magmatic and tectonic zone involving spreading, subduction, microplates and the Solomon arc.
11171.16°W ±3°Phoenix / Nova–Canton regionMajor old Pacific fracture-zone system; Nova–Canton Trough lies remarkably close to the 168.16°W outer line.
12141.16°W ±3°Central PacificWeakest equatorial case; no major active plate boundary directly at the principal longitude, although important fracture-zone and volcanic structures occur within the wider region.

What stands out

The most striking feature is that the sequence does not repeatedly select the same type of structure. Instead it encounters very different manifestations of lithospheric deformation:

spreading ridge → subduction margin → passive continental margin → spreading ridge → passive margin → continental rift → spreading ridge → subduction → arc collision → spreading/subduction complex → fracture zone → intraplate volcanic/fracture-zone province.

That heterogeneity may actually be important for the model. If the 30° divisions represent a deep mantle framework, one should not necessarily expect identical surface structures. Oceanic and continental lithosphere respond differently, and the existing plate geometry determines whether a mantle-related influence is expressed as spreading, faulting, rifting, volcanism or enhanced deformation at a pre-existing boundary.

Three cases are particularly clean geometrically:

21.16°W: the Romanche/Mid-Atlantic ridge region approaches the predicted +3° position at 18.16°W.

38.84°E: the Kenya Rift near 36.1°E approaches the predicted −3° position at 35.84°E.

171.16°W: Nova–Canton Trough near 168.01°W approaches the predicted +3° position at 168.16°W.

There is also an important distinction at 148°E, which is not one of the 30° lower-mantle divisions. As we discussed, that longitude belongs instead to the strong tectonic line produced by the overlapping tectonic-ring geometry. Independent studies find major tectonic changes around 147–149°E: east of ~148°E the Papuan plate boundary becomes increasingly extensional, while around 147–148°E earthquake slip-vector orientations and microplate relationships change markedly.

So we now have two different geometrical systems that should not be mixed:

The 30° sequence describes the proposed regular lower-mantle/convection-roll framework.

The ~29°E → ~91°W → ~148°E set arises from the geometry of the tectonic rings and appears to identify unusually strong zones of tectonic reorganisation.

Uncategorized

Spatial Correspondence Between the Convection-Roll Model and the Volcanic Zones of Iceland

One of the most striking features of the convection-roll model is the degree of spatial correspondence between the predicted roll boundaries and the observed volcanic zones of Iceland. This correspondence is not restricted to a single volcanic zone or to a few isolated localities. It is repeated in the positions of volcanic-zone margins, changes in direction, intersections, volcanic centres, and the polygonal areas enclosed by the modelled boundaries.

The principal volcanic zones used for comparison are the Western Volcanic Zone (WVZ), Eastern Volcanic Zone (EVZ), Northern Volcanic Zone (NVZ), the Reykjanes volcanic zone, and the volcanic belt crossing Central Iceland. These are well-established components of the Icelandic volcanic and plate-boundary system, although different terminology has been used for the Central Iceland connection between the main rift zones.

Specific examples of correspondence

Spatial Correspondence Between the Convection-Roll Model and the Volcanic Zones of Iceland.

A number of locations are particularly useful for illustrating the geometrical precision of the correspondence shown on the map:

  1. The Reykjanes volcanic zone south of Hveragerði.
    Here, one of the modelled boundaries coincides closely with the transition towards the South Iceland Seismic Zone (SISZ). The relationship is particularly informative because the SISZ forms the tectonic connection between the western and eastern rift systems of South Iceland.
  2. The Western Volcanic Zone and Langjökull.
    A modelled roll boundary closely follows the margin of the volcanic zone in the Langjökull area. The spatial relationship is sufficiently sharp to make this an important reference point when the model is compared with mapped volcanic systems.
  3. The Eastern Volcanic Zone north of Mýrdalsjökull.
    Another model boundary corresponds to the margin of the EVZ immediately north of the Mýrdalsjökull–Katla region.
  4. The Vatnajökull boundary and Grímsvötn.
    Within the Vatnajökull region, a major boundary in the convection-roll pattern passes through the area of Grímsvötn, one of the principal volcanic centres of the EVZ.
  5. The boundary extending northeastwards from Kverkfjöll.
    From the Kverkfjöll region, the mapped volcanic structures and the modelled roll boundary follow the same general northeastward direction.
  6. The outer boundary of the Kverkfjöll volcanic system.
    The extent of the Kverkfjöll system provides another example in which the margin of a volcanic system corresponds to a boundary in the convection-roll pattern.
  7. Internal boundaries within the Northern Volcanic Zone.
    The correspondence is not restricted to the outer margins of the NVZ. Several internal divisions within the volcanic zone also coincide with modelled roll boundaries.
  8. The northwestward bend of the Central Iceland volcanic belt.
    The Central Iceland Volcanic Zone, as defined here, bends towards the northwest in a manner that follows the geometry of the convection-roll pattern.
  9. A comparable bend in the Western Volcanic Zone.
    The WVZ displays a related change in orientation, extending towards another boundary in the modelled system.

10–11. The polygon occupied by the Northern Volcanic Zone.
A particularly clear geometrical relationship occurs in North Iceland, where the volcanic systems of the NVZ occupy a polygonal sector approximately 1.5° in longitudinal width. Both sides of this sector are defined by boundaries in the convection-roll system.

  1. The northern intersection point.
    The northernmost point highlighted on the map coincides with an intersection of two boundaries in the convection-roll framework. This is significant because intersections represent geometrically more restrictive predictions than correspondence with a single line.

The Eastern Volcanic Zone

The most continuous correspondence on the map occurs along the Eastern Volcanic Zone (EVZ).

Four large polygonal sectors of the convection-roll framework are occupied by the volcanic systems shown in yellow on the map. Rather than simply following a single line, the volcanic zone repeatedly fills the areas enclosed by successive boundaries.

The relationship also places several major volcanic centres and systems—including Hekla, Tindfjöll, Eyjafjallajökull, Katla beneath Mýrdalsjökull, and the Vestmannaeyjar volcanic system—within the same geometrical arrangement.

This is important because the comparison therefore involves several different geometrical properties simultaneously: boundaries, intersections, enclosed areas, changes in orientation, and the positions of individual volcanic centres.

The Western Volcanic Zone

Immediately west of the EVZ, the eastern margin of the Western Volcanic Zone (WVZ) is particularly distinct.

In the convection-roll framework, this boundary occurs approximately 3° west of the corresponding eastern boundary of the EVZ. Thus the two volcanic zones are not treated as unrelated features. They occupy neighbouring parts of the same regularly spaced geometrical system.

The WVZ also changes orientation towards its northern end, and this curvature can be compared with the orientation of the modelled roll boundaries.

Central Iceland

The Central Iceland volcanic belt shows a somewhat different type of correspondence.

Here the most prominent geometrical control is not simply a volcanic zone centred on a modelled line. Instead, one of the sharpest boundaries of the volcanic area corresponds to a downwelling boundary extending northeastwards from the region.

This distinction may be important. If upwelling and downwelling boundaries have different mechanical effects on the lithosphere, volcanic zones should not necessarily occupy identical positions relative to each type of boundary.

The Northern Volcanic Zone

The Northern Volcanic Zone (NVZ) provides another particularly clear example.

Its principal volcanic systems are arranged along a predominantly north–south to NNE–SSW axis, while their outer limits correspond to polygonal boundaries in the convection-roll framework. Independent geological studies also show that the NVZ consists of several overlapping volcanic systems and fissure swarms, including Kverkfjöll, Askja, Fremrinámur, Krafla and Þeistareykir.

In the present model, both upwelling and downwelling lines appear to contribute to the geometry of the volcanic zone. The correspondence therefore concerns not merely the central axis of volcanism but also its width and internal subdivision.

Features not fully visible on the map

The map does not show all the relationships that can potentially be tested.

Among the additional examples are the position of Öræfajökull, the geometrical relationship between Snæfellsjökull and Snæfell, and the former Skagafjörður volcanic zone.

The Skagafjörður system is particularly interesting in this context because its position is approximately 3° west of the Northern Volcanic Zone in the geometrical framework used here. Older rift structures in the Skagi region are independently recognised in geological studies of Iceland.

The offshore continuation provides further constraints. The orientations and positions of both the Reykjanes Ridge and the Kolbeinsey Ridge can be compared with the same convection-roll geometry. The Icelandic volcanic zones therefore form only the subaerial part of a considerably larger geometrical pattern.

Plate motion and the orientation of the roll boundaries

The two-dimensional geometrical correspondence is only part of the problem. The system must ultimately be interpreted in three dimensions because the lines on the map represent boundaries associated with several superimposed levels of convection rolls.

Plate motion must also be incorporated.

In the interpretation proposed here, the motion of the North American Plate away from the spreading system produces a major westward to northwestward extensional component across Iceland. This regional movement interacts with the directions of rotation of the underlying convection rolls.

This provides a possible explanation for an important feature of the map: the eastern margins of several volcanic zones are commonly associated with the blue boundaries of the model.

In the convection-roll interpretation, the roll adjacent to such a boundary rotates in a direction opposite to the motion imposed from the North American side. The opposing motions would increase differential movement across the boundary and could therefore favour extension of the overlying lithosphere.

A comparable relationship can be seen along the eastern side of the Northern Volcanic Zone, where several of the principal extensional structures are again bounded on their eastern side by blue lines.

This proposed relationship between plate motion, roll rotation and surface extension is important because it introduces a dynamic component into what would otherwise be only a geometrical comparison.

From geometrical correspondence to a testable model

The significance of the pattern lies in its repetition.

No single coincidence between a volcanic centre and a modelled boundary would provide strong evidence for a relationship. The more relevant observation is that similar relationships recur independently at the margins of several volcanic zones, at changes in their direction, at volcanic centres, at intersections, and within polygonal sectors of the model.

The Eastern Volcanic Zone is especially informative because the correspondence is repeated through several consecutive polygons rather than occurring at only one locality.

The Icelandic pattern can therefore be tested at several levels:

  • the distance between mapped volcanic-zone margins and predicted roll boundaries;
  • the angular agreement between volcanic structures and the modelled lines;
  • the positions of volcanic centres relative to predicted intersections;
  • the width of volcanic zones relative to the predicted polygonal cells;
  • the relationship between active and extinct volcanic zones and successive boundaries in the model;
  • and the relationship between the direction of plate motion and the inferred rotation of individual convection rolls.

Such tests would allow the apparent correspondence to be expressed quantitatively rather than only visually.

The important point is therefore not simply that volcanic activity occurs near individual lines. It is that the geometry of the Icelandic volcanic zones repeatedly reproduces several different elements of the proposed convection-roll framework—lines, margins, bends, intersections and enclosed polygons—at a range of locations across Iceland.

Uncategorized

Tectonic boundaries and convection-roll divisions in Iceland

When considering the spreading of Iceland and the boundary between the North American and Eurasian plates, three main types of tectonic boundaries or structures need to be taken into account. These are, first, mid-ocean ridges; second, volcanic zones; and third, seismic zones. Within the convection-roll model, all of these follow lines that can be constructed on a map on the basis of the geometrical analysis of the convection rolls.

Reykjanes Ridge, East Volcanic Zone and Tjörnes Fracture Zone.

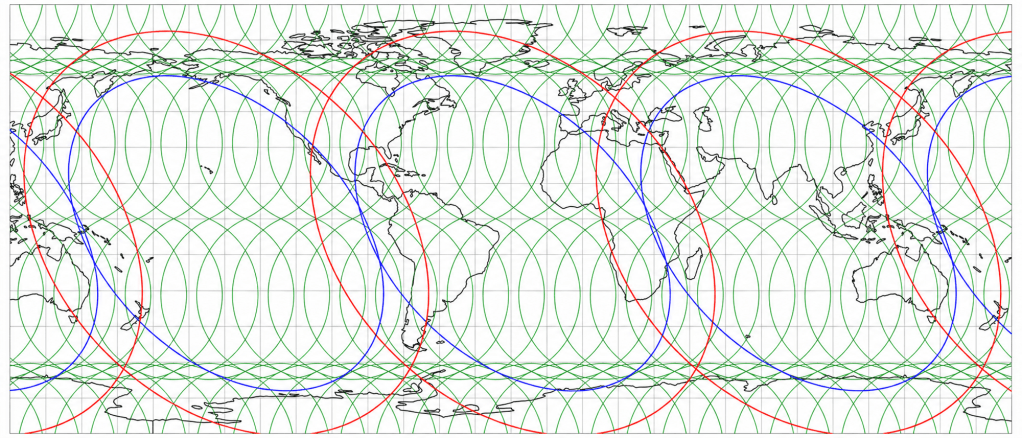
The convection-roll system follows a simple mathematical pattern, with each depth layer having its own set of convection rolls. In Iceland, however, the situation is more complex than in many other regions because the convection rolls of the polar system and the equatorial system meet and interact there. The correspondence is clearly visible on the map. The Reykjanes Ridge, for example, follows convection-roll divisions associated with the 120 km level over a considerable distance.

Main Upper Layers.

In southern Iceland, the situation is further complicated by the fact that division lines belonging to convection rolls at different depths often lie very close to one another, so that they may appear almost as a single line. A precise description of the boundaries shown on the map is therefore considerably more complex than the simplified interpretation presented here. The depth levels are used primarily as convenient reference levels.

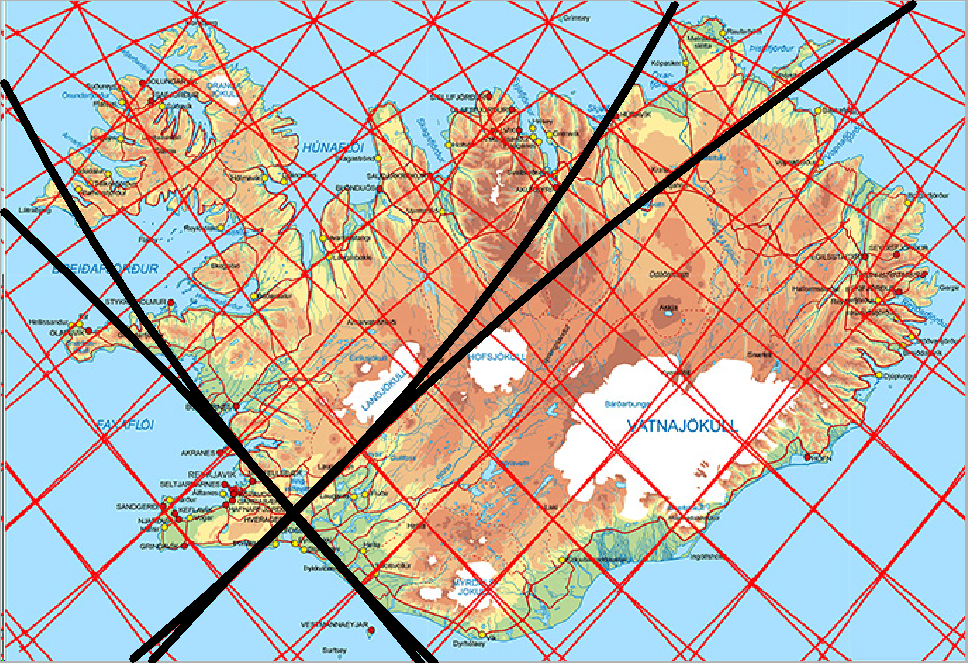
As can be seen, the comparison can be extended across the whole of Iceland, revealing correspondences between the calculated lines and geological structures. Blue downwelling lines reproduce the eastern boundaries of both the Eastern Volcanic Zone and the Western Volcanic Zone with considerable precision. The geometry also shows that the two volcanic zones are separated by approximately 3°.

A similar relationship occurs in the Tjörnes Fracture Zone in northern Iceland. There, two principal seismic source lines correspond to adjacent convection-roll division lines separated by 1.5°. As more geological information is incorporated into the comparison, an increasing number of features can be tested against, and found to correspond with, this convection-roll framework.

To compare these lines with the 120–670 km System Section, each mapped line can be related to the boundary of a particular depth interval. The section illustrated here applies to regions south of 60.7°N and also north of 67.3°N. Within the intervening latitude range, the geometry is considerably more complex: the number of layers effectively doubles, while their thicknesses vary with latitude. Nevertheless, the basic division is retained, and each layer can still be followed mathematically, allowing the boundaries of the convection rolls to be constructed with precision.

The polar system takes over progressively from the equatorial system and is superimposed upon it. At 64°N, however, the two systems act in combination, and the convection rolls of the two systems are aligned directly above one another. North and south of this latitude, the corresponding rolls gradually diverge from one another. Farther north, the polar system becomes increasingly dominant.

It is particularly noteworthy that the principal seismic zones—the Tjörnes Fracture Zone and the South Iceland Seismic Zone—are associated with different convection-roll division lines from those followed by the Reykjanes Ridge and the volcanic zones. These seismic-zone divisions are related to deeper parts of the system, specifically to the convection rolls immediately above the 410 km boundary. The same geometrical pattern is then repeated between the 410 km and 670 km depth levels.