The Ring of Fire is difficult to define precisely, but it is increasingly recognized that the system exhibits an overall circular geometry, particularly when the volcanic regions of Antarctica are considered as part of the broader pattern. This observation deserves careful attention, and several key reference points can be used to define the geometry of the Ring of Fire.
The Minor Axis of the Ring of Fire
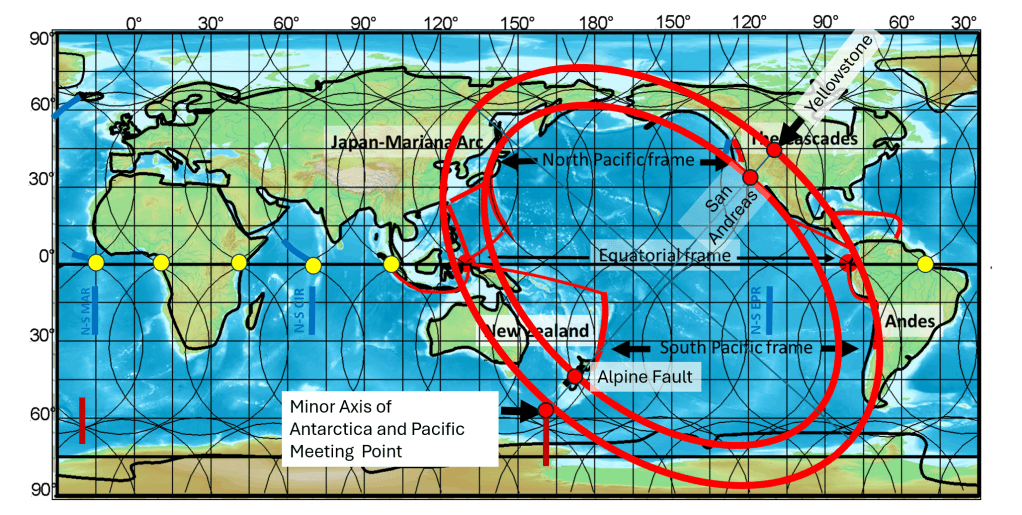
Yellowstone, San Andreas, Alpine Fault of New Zealand, and the Antarctic Plate.
The first and most widely recognized reference is the San Andreas Fault in California. Part of this fault aligns so closely with the inferred geometry that it undergoes continuous creep without generating significant earthquakes. For this reason, a representative point along the San Andreas Fault is selected as a reference point on the map.
On the opposite side of the Ring of Fire lies the Alpine Fault of New Zealand. Unlike the San Andreas Fault, the Alpine Fault is oriented approximately perpendicular to the adjacent margin of the Ring. This suggests that different tectonic adjustments occur along the line connecting these two major fault systems.
Additional features are found along the same axis. To the northeast lies the Yellowstone volcanic region, while to the southwest is the junction between the elliptical forms of the Pacific and Antarctic plates.
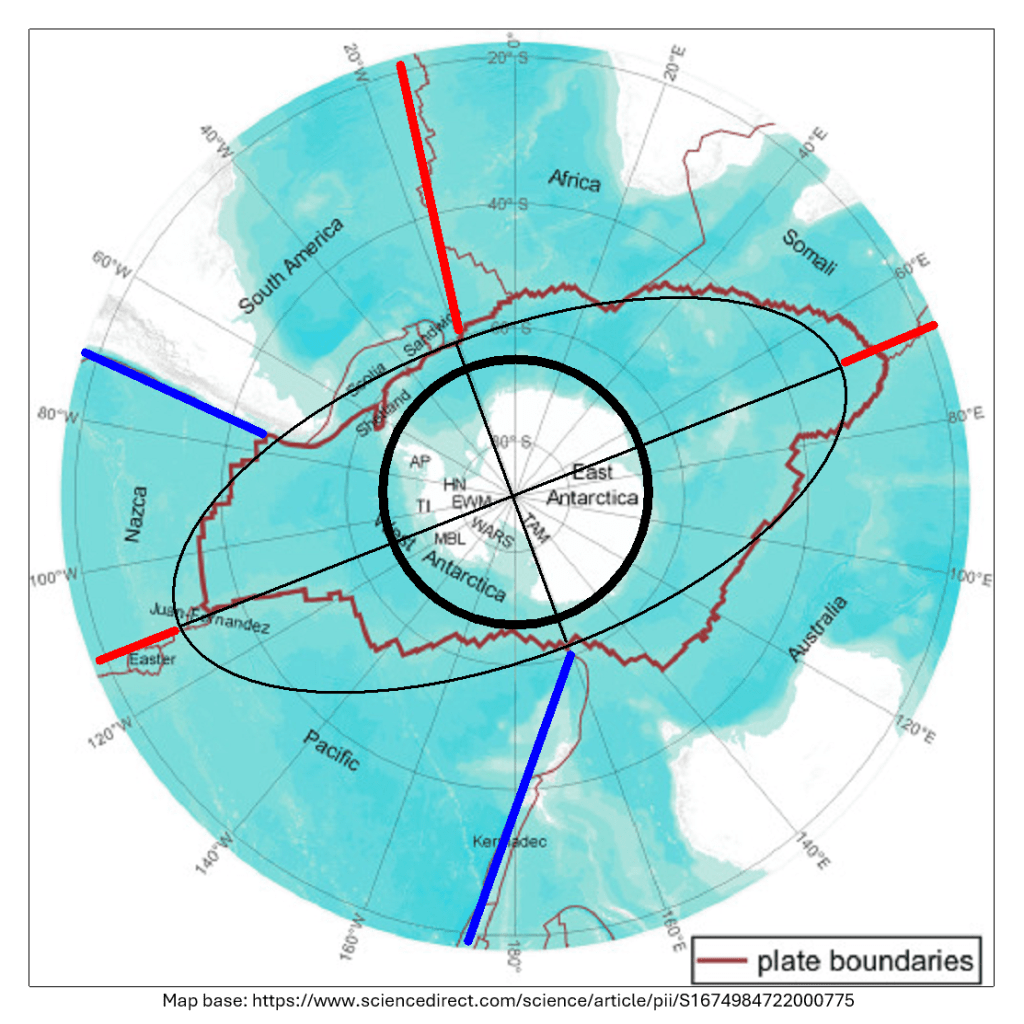
The Antarctic Connection
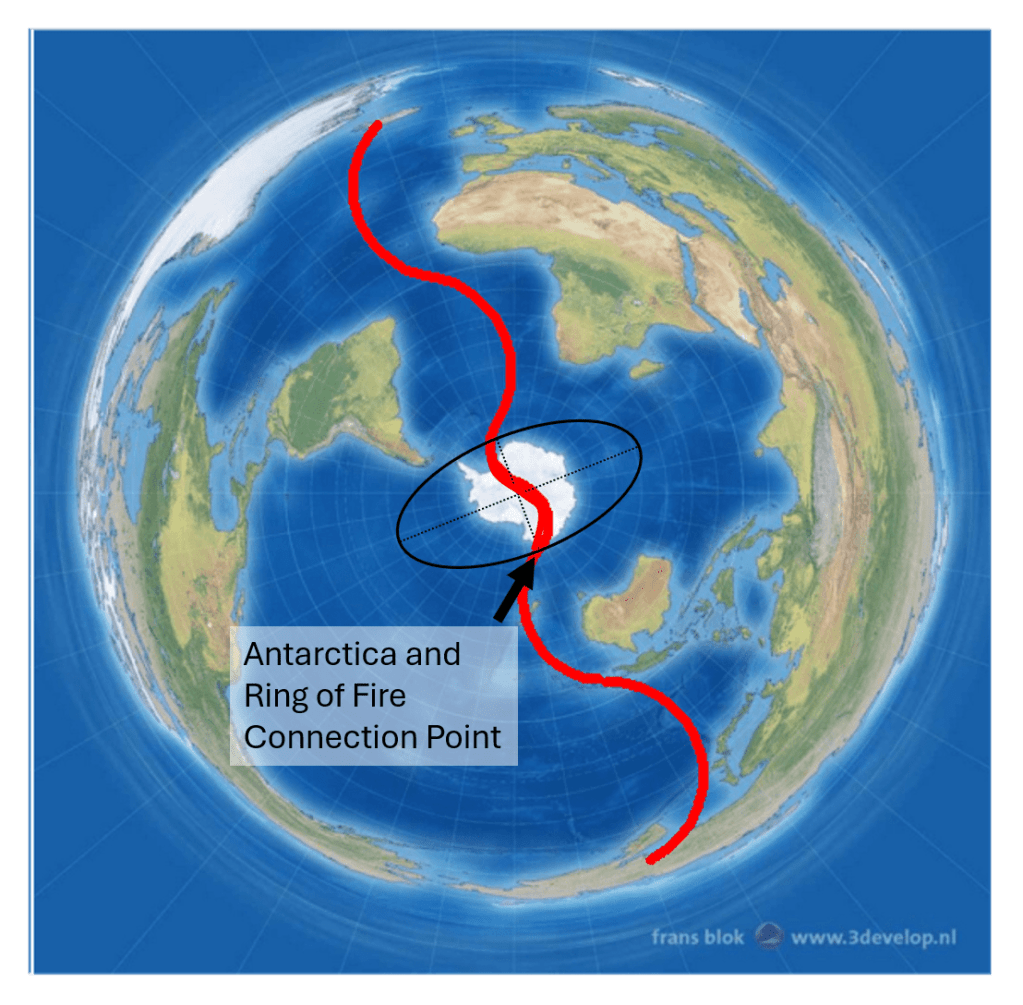
showing the inferred connection point linking Antarctica to the Ring of Fire system.
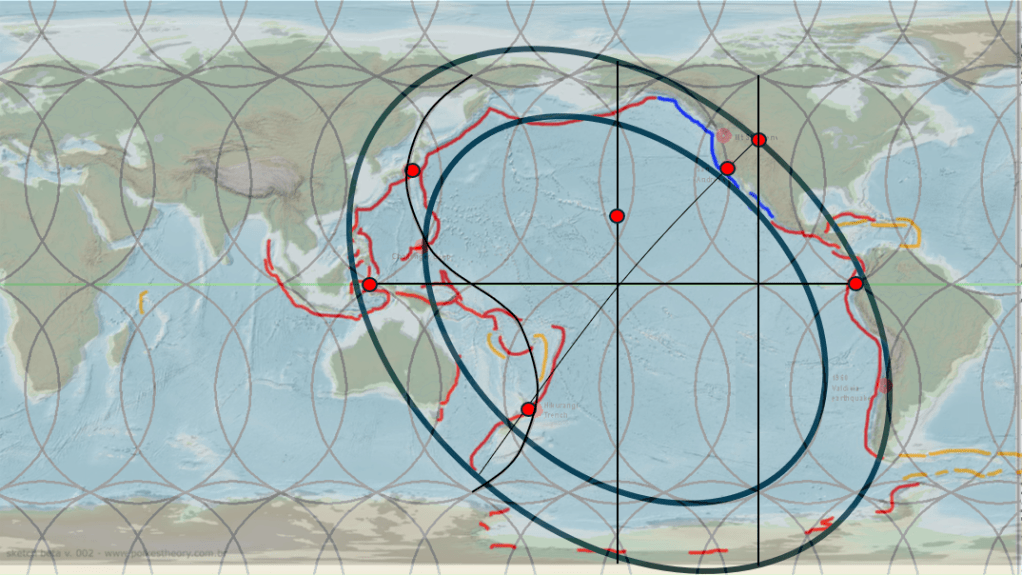
The geometry of the Ring of Fire can then be completed by extending the circle so that it passes through two equatorial reference points: the eastern coast of Indonesia and the western coast of South America.
The resulting elliptical form is nearly symmetric about the equator. However, its center lies slightly south of the geographic equator, consistent with the position of the so-called tectonic equator.
Why Examine the Ring of Fire More Closely?
As the Ring of Fire displays a remarkable correspondence with a number of geological features, suggesting that its position and geometry are not entirely coincidental but instead follow certain large-scale patterns, it is worthwhile to examine its structure in greater detail and attempt to explain its existence more thoroughly.
The Equatorial Boundaries of the Ring of Fire
Previous sections have discussed the relationship between the equator and the subduction zones of eastern Indonesia and Peru. One of the first observations is the apparent correspondence between the Ring of Fire and the equatorial region.
These two equatorial points are approximately 150° apart and, in this interpretation, define the outer limits of the Ring of Fire. The Ring itself extends somewhat beyond these points, which is reasonable given that the effects of subduction continue beyond the immediate trench systems.
The Ring of Fire also exhibits relatively distinct inner and outer boundaries, making it useful to examine the inner boundary along the equator as well.
Papua New Guinea and the Galápagos Connection
Both in Indonesia and Peru, connections can be identified between the outer and inner rings near the equatorial line.
Along the northern coast of Papua New Guinea, several geological structures can be traced that follow this pattern. Similarly, west of Ecuador, the Galápagos Spreading Center extends across the eastern Pacific toward the Galápagos Islands, which in this model lie close to the inner boundary of the Ring of Fire.
The Galápagos region is particularly noteworthy because it marks the interaction between oceanic spreading processes and the eastern margin of the Pacific subduction system.
Antarctica and the Southern Extension of the System
A similar relationship can be identified along the minor axis of the Antarctic Plate ellipse.
The outer ring intersects the northern extension of the minor axis, while the southern end is associated with the plate boundary system south of New Zealand. This boundary includes the Puysegur, Macquarie, and Hjort trench systems and connects northward through the Alpine Fault of New Zealand.
The Alpine Fault shares some characteristics with the San Andreas Fault, although its orientation and tectonic setting are significantly different.
The northern endpoint of the minor axis corresponds approximately to the region of Yellowstone in North America.
Japan and the Northwestern Pacific
Attention should also be given to Japan.
The Inner Ring Through Japan
In this interpretation, the inner ring closely follows a major geological corridor extending from Hokkaido through Honshu to the vicinity of Mount Fuji.
The major axis lies somewhat farther north and approaches the tectonic junction near Sakhalin Island.
The Outer Ring and Eastern Asia
The outer ring approximately follows the transition zone between the highlands of western China and the lower-lying regions of eastern China.
The inner ring also links the endpoints of the Kuril Islands, Kamchatka Peninsula, and the Aleutian Islands, which together form one of the most continuous volcanic arcs on Earth.
South America and Antarctica Within the Ellipses
The Andes Volcanic Arc
In South America, the ring encompasses the major volcanic chains of Peru and Chile, which are associated with subduction of the Nazca Plate beneath the South American continent.
The resulting volcanic arc contains many of the highest active volcanoes on Earth.
Antarctic Volcanism
Likewise, most of the volcanoes of Antarctica fall within the two ellipses, including those of the West Antarctic Rift System and the volcanic provinces associated with Mount Erebus.
Subduction Zones Beyond the Elliptical Framework
A substantial portion of the western Pacific subduction zones, however, lies outside the circular region defined by these ellipses.
The Mariana System
South of Japan, the Izu–Bonin Trench extends southward before curving into the Mariana Trench. The trench contains the Challenger Deep, the deepest known point in Earth’s oceans.
Tonga, Kermadec and Hikurangi
Farther south, the Tonga Trench, Kermadec Trench, and Hikurangi Margin also lie inside the ellipses.
These regions represent areas where convergent plate interactions are strongly influenced by the westward motion of the Pacific Plate relative to neighboring plates.
The Northeastern Pacific Margin
It is also interesting to observe how the Juan de Fuca Ridge terminates near the inner boundary of the Ring of Fire.
From Juan de Fuca to Central America
From there southward toward Central America, a diverse range of tectonic boundaries—including spreading ridges, transform faults, and subduction zones—coincides with the inner ellipse.
This transition illustrates the complexity of the northeastern Pacific margin, where different styles of plate interaction are concentrated within a relatively narrow geographical corridor.
The Ring of Fire as a Global Tectonic System
Several additional observations support the significance of the Ring of Fire as a coherent tectonic system.
Approximately 75% of the world’s active volcanoes and about 90% of global earthquakes occur along its margins. The Ring extends for roughly 40,000 km around the Pacific Ocean and represents the surface expression of a nearly continuous network of subduction zones and volcanic arcs.
Although local plate interactions explain many individual features, the overall geometry of the system remains one of the most striking large-scale tectonic patterns on Earth, inviting further investigation into the deeper mantle processes that may influence its development.
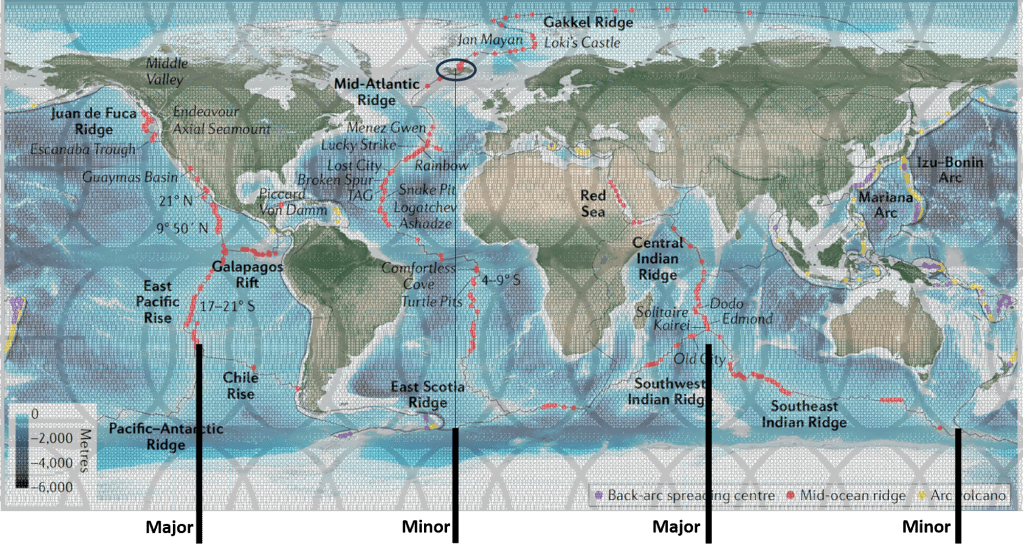
The 30° Equatorial Pattern
Another aspect that should be incorporated into the overall picture is the series of reference points located along the equator at intervals of approximately 30°.
Major Geological Features Along the Equator
These points coincide with several major geological features:
- The western margin of South America
- The Mid-Atlantic Ridge
- Western Africa
- The East African Rift System
- The Central Indian Ridge
- Western Indonesia
The regular spacing between these features is striking and raises the question of whether the pattern reflects an underlying large-scale organization rather than a random distribution.
A Geometric Division of the Equator
From a geometric perspective, these locations divide the equatorial circumference into six segments of roughly equal width.
While plate tectonics explains the individual features through regional processes, the apparent regularity of their spacing invites consideration of whether deeper mantle-scale processes may also contribute to their positioning.
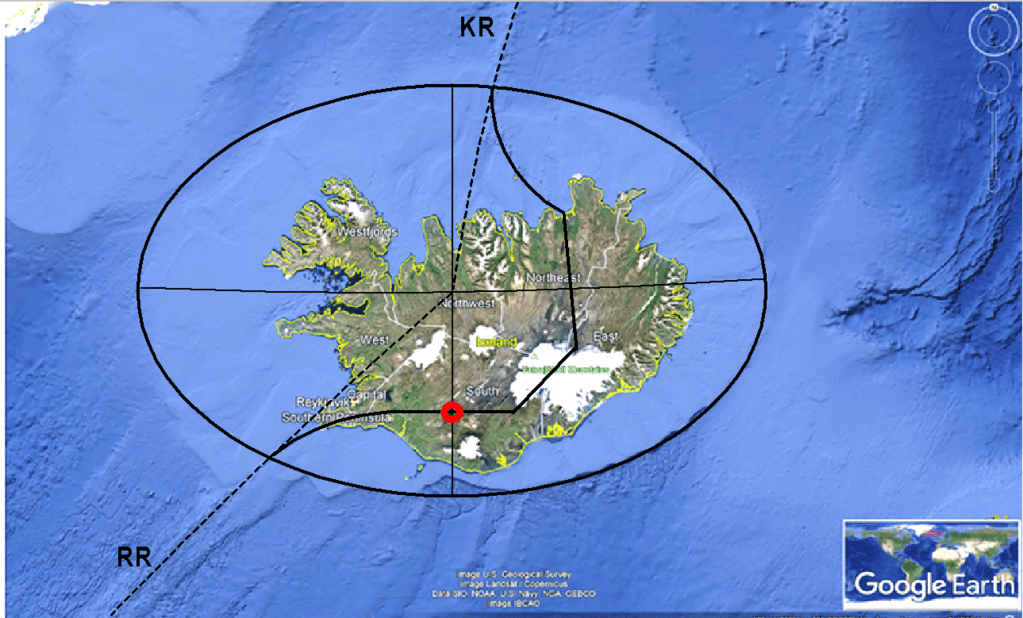
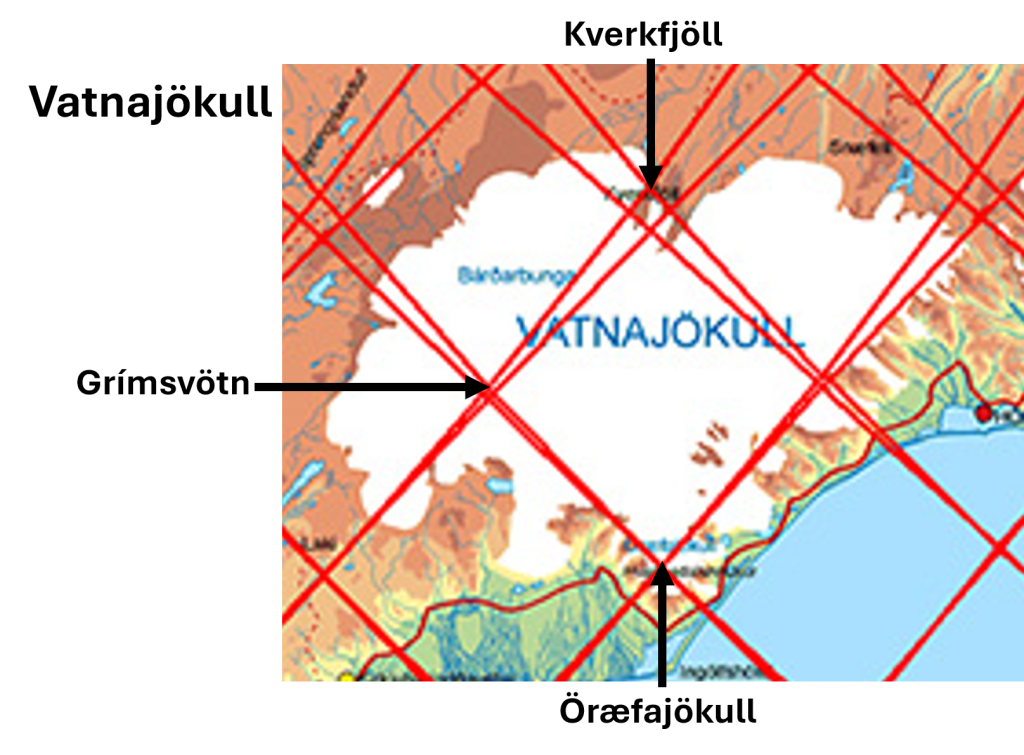
The Mid-Atlantic Ridge, Iceland and Antarctica
Particularly noteworthy is the location of the Mid-Atlantic Ridge at the equator.
A Key Reference Point
This point lies close to the midpoint of the Atlantic Ocean and aligns not only with the central axis of Iceland but also with the central axis of Antarctica as defined by the minor axis of the Antarctic Plate ellipse.
In this interpretation, the equatorial intersection of the Mid-Atlantic Ridge becomes a key reference point linking the North Atlantic, Iceland, and Antarctica within a common geometric framework.
Connecting Antarctica and the Ring of Fire
Continuing along this alignment toward the opposite side of the Antarctic ellipse leads to another significant observation.
A Shared Geometrical Reference Point
The extension of the Antarctic minor axis intersects the region where the minor axis of the Ring of Fire is proposed to cross the Pacific basin.
Thus, the Antarctic and Pacific systems appear to share a common geometrical reference point.
If this relationship proves to be meaningful rather than coincidental, it suggests that the geometries of the Antarctic Plate and the Ring of Fire may be connected through a larger-scale global tectonic pattern.
A Global Network of Geometric Relationships
The significance of these alignments becomes more apparent when viewed together.
The 30° spacing of major equatorial geological features, the alignment of the Mid-Atlantic Ridge with Iceland and Antarctica, and the apparent intersection between the minor axes of the Antarctic and Pacific systems collectively form a network of geometric relationships extending across the globe.
Whether these relationships arise from mantle convection, plate interactions, or another large-scale organizing mechanism remains open to investigation.
However, the consistency of the observed geometry suggests that such correlations deserve careful examination rather than being dismissed as mere coincidence.
Mantle Convection and the 30° Spacing
It should also be noted that the 30° spacing corresponds to one-twelfth of Earth’s circumference.
A Possible Mantle Connection
This value is noteworthy because it matches the proposed spacing of large-scale mantle convection structures discussed elsewhere in this work.
Under that interpretation, the equatorial points may represent surface expressions of deeper mantle organization, linking mid-ocean ridges, continental rifts, and subduction systems into a single global framework.
Conclusions
Such a possibility would provide a natural explanation for why several of Earth’s most prominent tectonic features appear at regular intervals around the equator.
Whether this interpretation ultimately proves correct remains a matter for further investigation, but the geometric relationships identified here suggest that the Ring of Fire, Antarctica, Iceland, and the major equatorial tectonic features may form part of a larger and more integrated global pattern than is commonly recognized.