Everyone notices that Antarctica is centered around the South Pole. It has not always occupied this position, and over geological time it will eventually drift toward other latitudes. So why should its present location matter? Many people may consider it coincidental, yet the degree of regularity surrounding Antarctica is nevertheless worth examining.
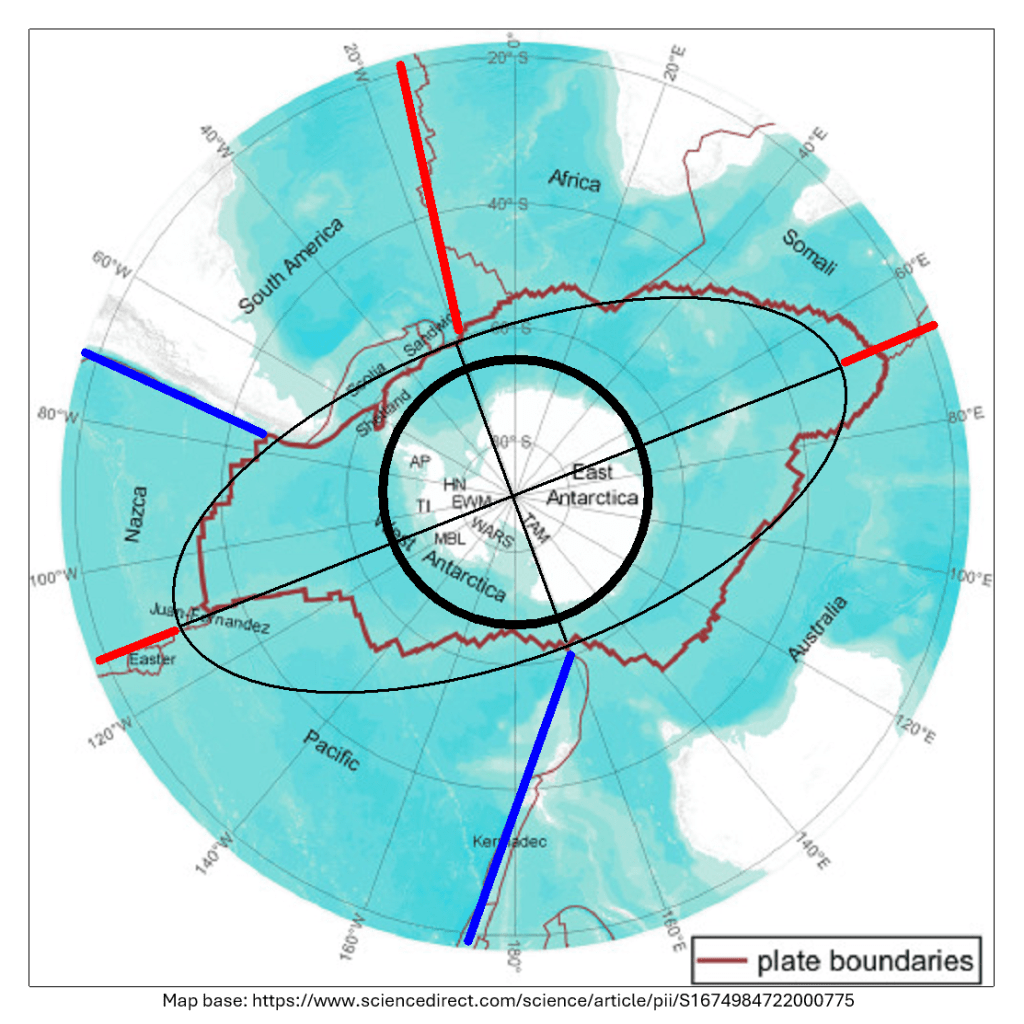
The mainland of Antarctica is not perfectly circular, but a circle drawn around the coastline of East Antarctica, centered on the South Pole, also broadly encompasses the Antarctic Peninsula. This gives the continent as a whole a remarkably regular appearance https://www.sciencedirect.com/science/article/pii/S1674984722000775.
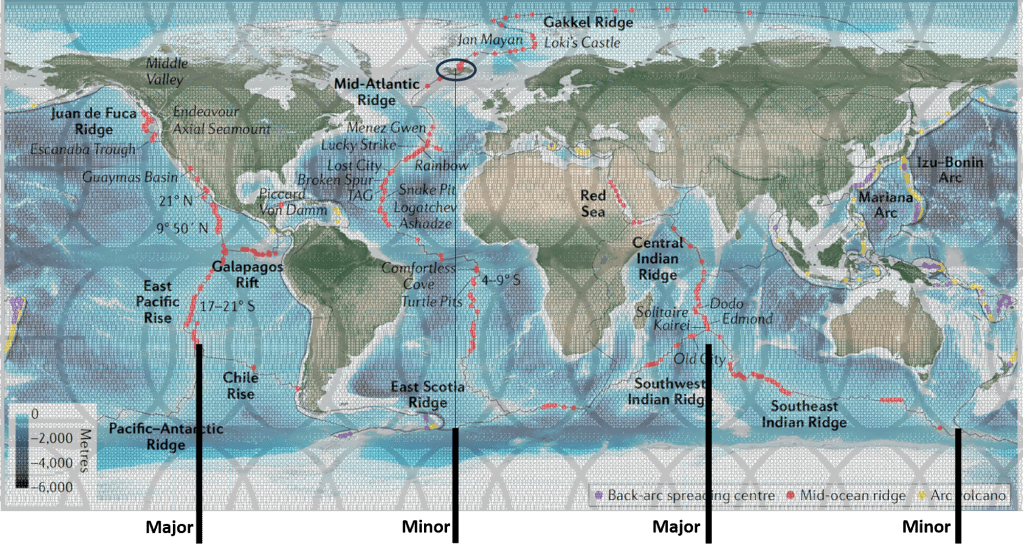
Antarctica is also almost completely encircled by mid-ocean ridges. The Antarctic Plate can therefore be regarded as a growing tectonic plate, since mid-ocean ridges expand outward on both sides according to the standard plate-tectonic model accepted by most geologists.
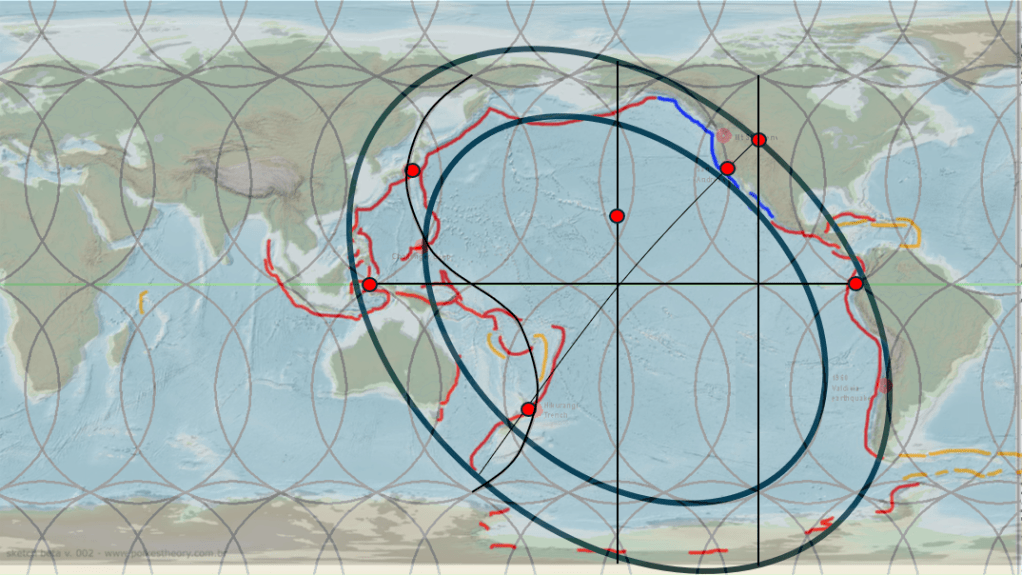
When the oceanic part of the Antarctic Plate is examined, it roughly fits an elliptical form centered on the South Pole, with one side extending from East Antarctica and the other from West Antarctica, along the geometrical major axis. Tracing the East Pacific Rise, and the Mid-Indian Ridge, they connect closely with the endpoints of the ellipse’s major axis.
Looking at the minor axis, the Mid-Atlantic Ridge approaches one endpoint rather closely, while the Puysegur Trench subduction zone, extending from New Zealand, connects near the opposite endpoint. Another major subduction system, along the western margin of South America where the Nazca Plate meets the South American Plate, touches the elliptical form at a position approximately equidistant from the Pacific and Atlantic ridge systems.
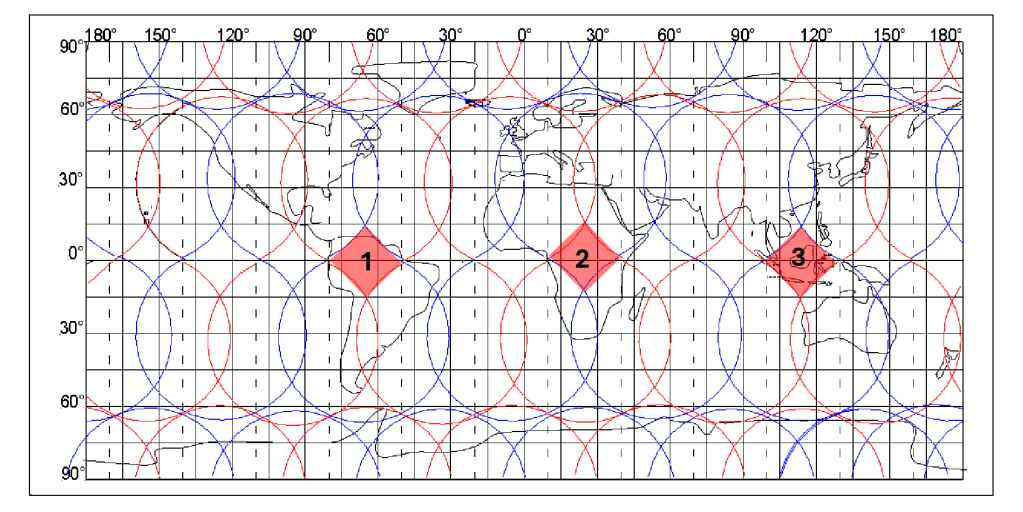
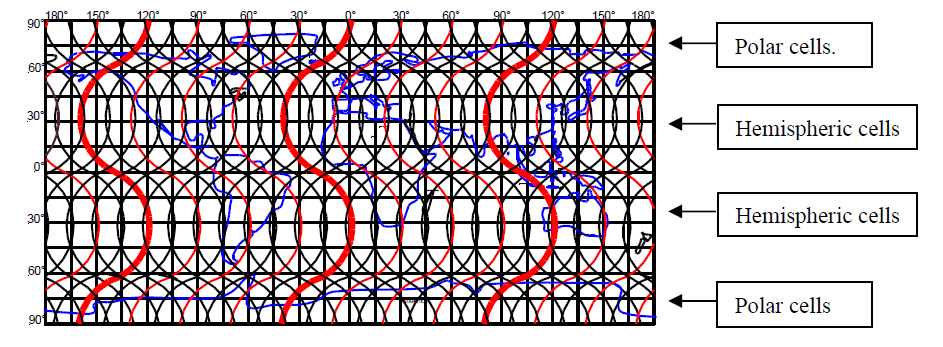
This degree of regularity can be observed directly on a simple world map. In addition, it fits well with the convection-roll framework examined here, since mid-ocean ridges outside this elliptical form around Antarctica, mainly tend to follow north–south alignments inherent in the mantle convection rolls model.
Within this interpretation, Antarctica is confined within the polar portion of the convection-roll system, bordering the transition zone of the model between 60.7°S and 67.3°S. From this perspective, the present position of Antarctica becomes relevant not only because of the regularity visible on the world map itself, but also because of the way these large-scale features appear to correspond with the mantle convection-roll model being explored here.
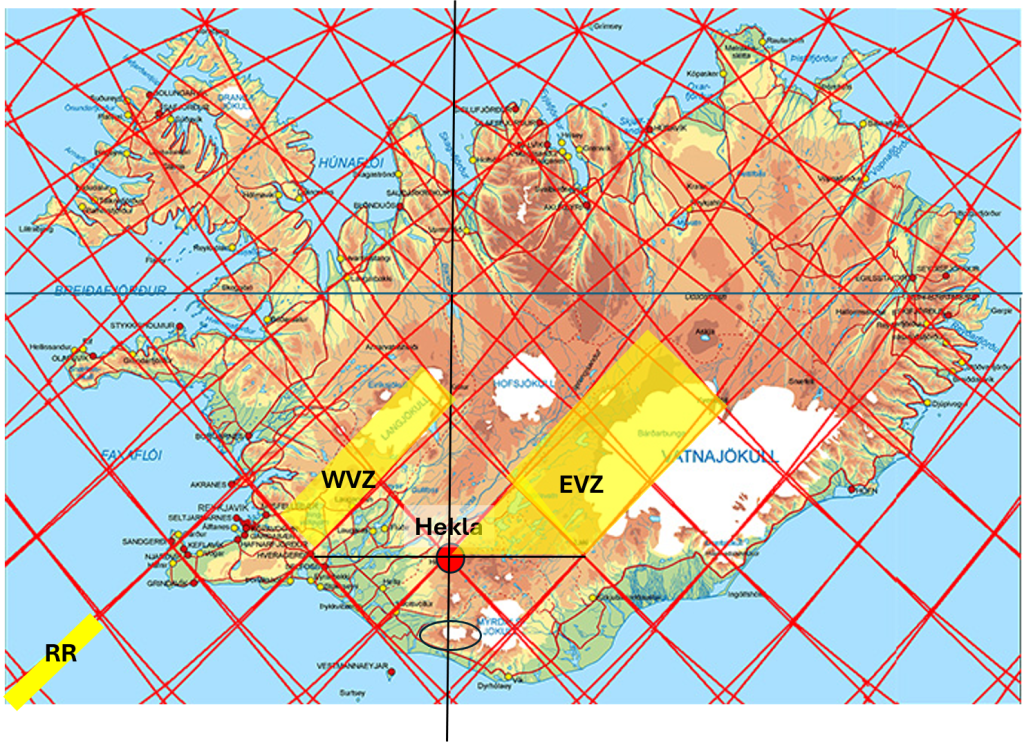
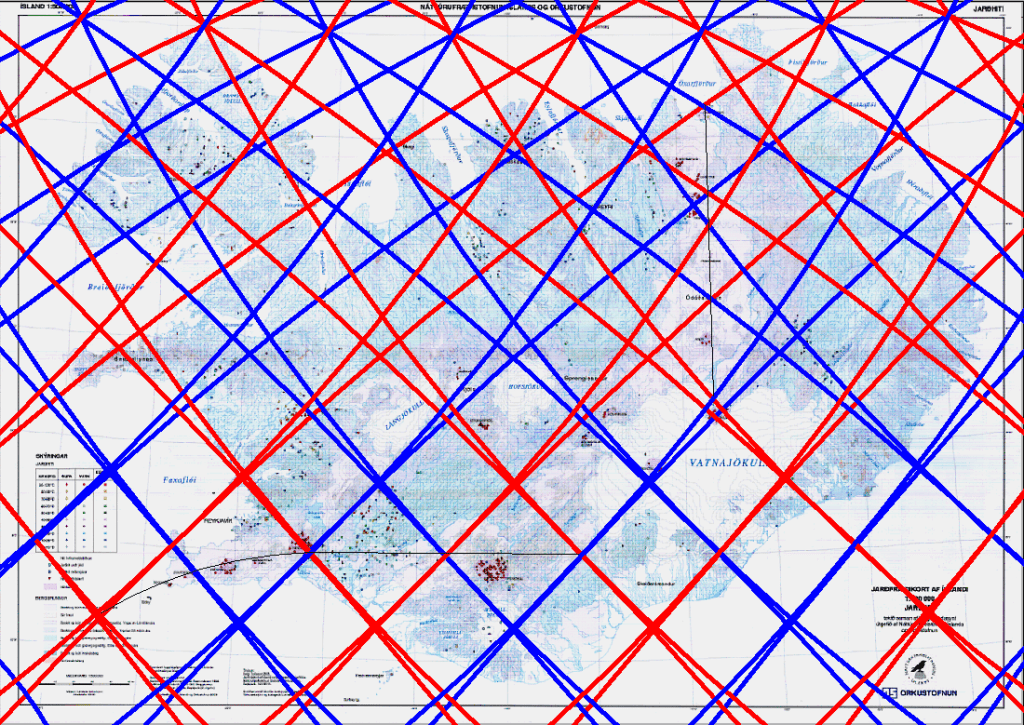
In addition, comparing with the Icelandic elliptical form, the minor axis is found along the same longitude.
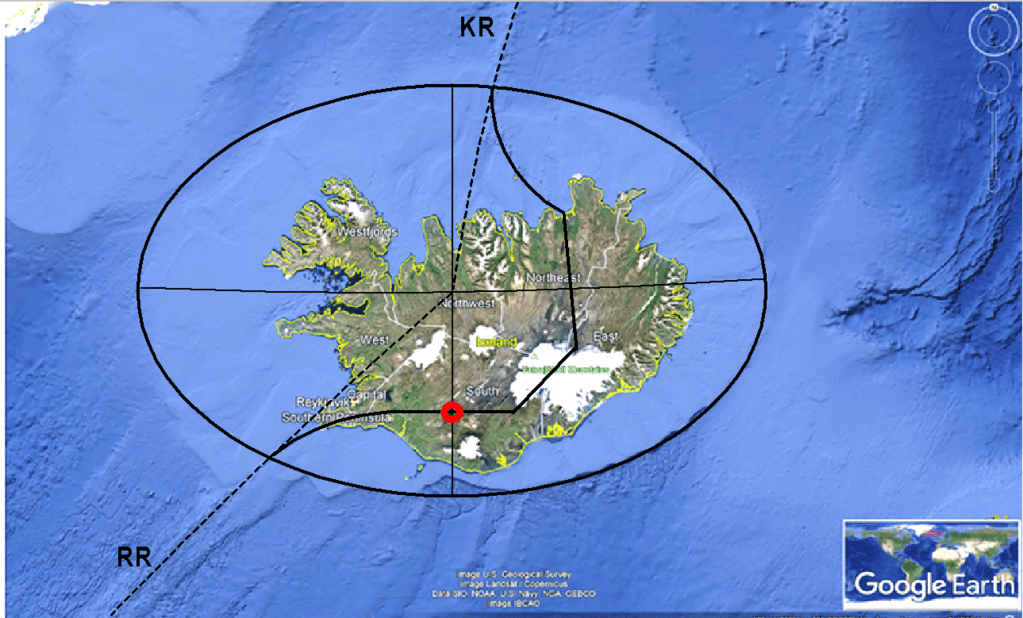
Those two elliptical forms of the Antarctic and Icelandic continental shelfs, which can be identified with reasonable accuracy, both have a minor axis along 19°40′W. The Mid-Atlantic Ridge is obviously north-south oriented, but this consistency between Iceland and Antarctica clearly adds to that concept.
The Icelandic continental shelf is indicated on the map. This interpretation is based on the mantle convection rolls model and the related large-scale structural pattern. The minor axis coincides with the transition zone between polar- and equatorial-related convection rolls, while the major axis extends toward the central part of the equatorial convection rolls. Map base: https://oceanobservatories.org/2022/11/nature-review-paper-reveals-new-understandings-of-mid-ocean-ridge-systems/