The map used below to indicate the location of convection rolls beneath Iceland is derived from this section of the Earth’s layers. Tracing the process from the consistent thickness of each layer to the exact location of the convection rolls—and thereby constructing a three-dimensional model of the Earth—is, of course, a complex and lengthy task. With this map, however, meaningful comparisons can be made, and a few are outlined below.

the lower mantle contains two sets of rolls, each 15° wide.
A geological map of Iceland can then be compared with the model:
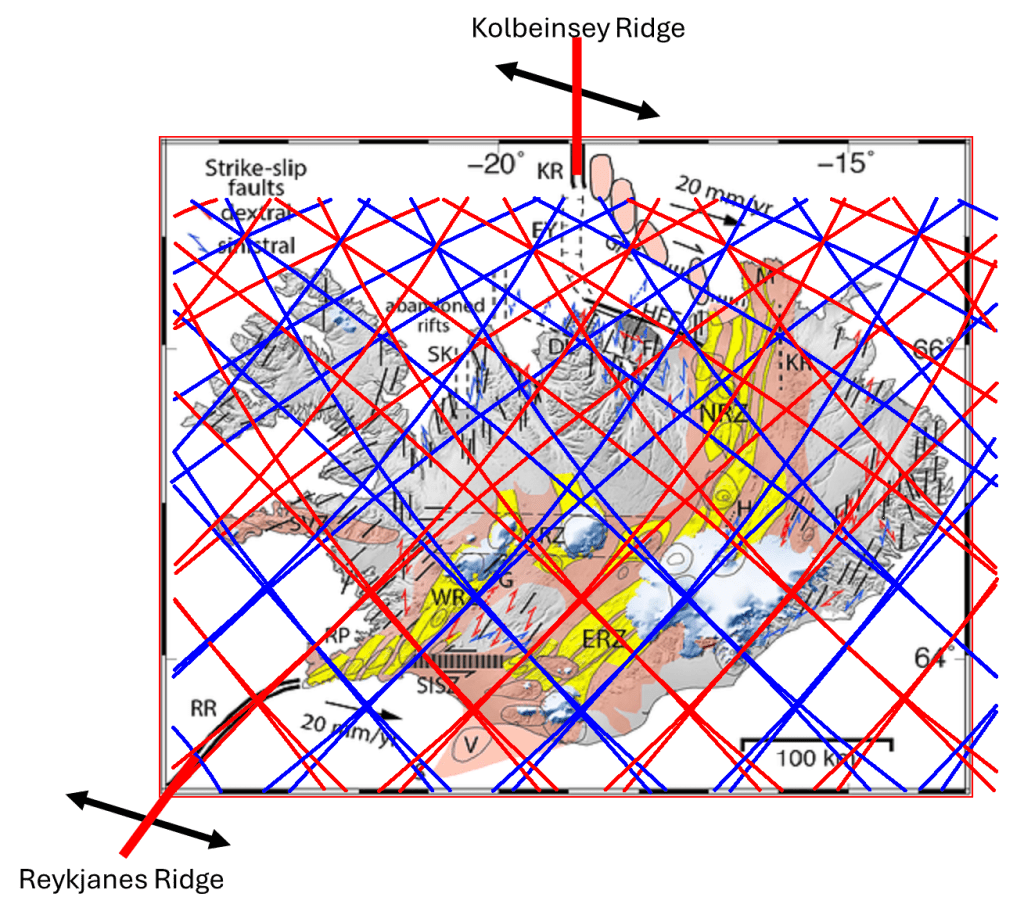
This map shows the location of both the Reykjanes Ridge and the Kolbeinsey Ridge. Although the map is a simplification and is neither fully accurate nor perfectly aligned with the calculated grid, a few features can still be immediately observed:
1. Volcanic zones match the grid.
Those familiar with the geology of Iceland will notice that the sharp boundaries of the volcanic zones correspond closely with the division lines between convection rolls. The distinction between upwelling and downwelling also clearly influences the distribution of these volcanic zones. Furthermore, the pattern defined by the division lines has explanatory value: the differing orientations of the East Volcanic Zone and the North Volcanic Zone are consistent with the distinct grid patterns observed in the southern and northern halves of Iceland.
2. Seismic zones match the grid.
The South Iceland Seismic Zone, as identified through geophysical measurements, is located between Hekla and Hveragerði, precisely within one of the polygons defined by the grid. The Tjörnes Fracture Zone also aligns with the division-line pattern observed along the northern coast.
3. Distribution of geothermal areas.
The distribution of geothermal areas also corresponds with the model. Low-temperature areas are associated with specific polygons and tend to cluster within them. In contrast, high-temperature areas are associated with division lines, their intersections, and the boundary between the Eurasian Plate and the North American Plate.
4. Local tectonic alignment within polygons.
Tectonic features within the polygons, such as volcanic fissures, are aligned according to the geometry of each polygon, reflecting the structure imposed by the convection rolls. These alignments do not follow the general direction of plate motion, suggesting that the model explains a major structural trend not accounted for in previous models.
5. NW–SE and NE–SW fissure patterns.
In some cases, fissures exhibit a NW–SE alignment consistent with the mirrored structure of the underlying convection rolls. Different layers display different roll orientations, while maintaining symmetry relative to the north–south axis. The coexistence of NW–SE and NE–SW trends has not been satisfactorily explained by other models.
Many additional aspects of consistency between the model and surface expressions have been discussed here.
