Explaining this is becoming easier with good drawings. AI got the idea! Please have a look at this map:
Try this yourself
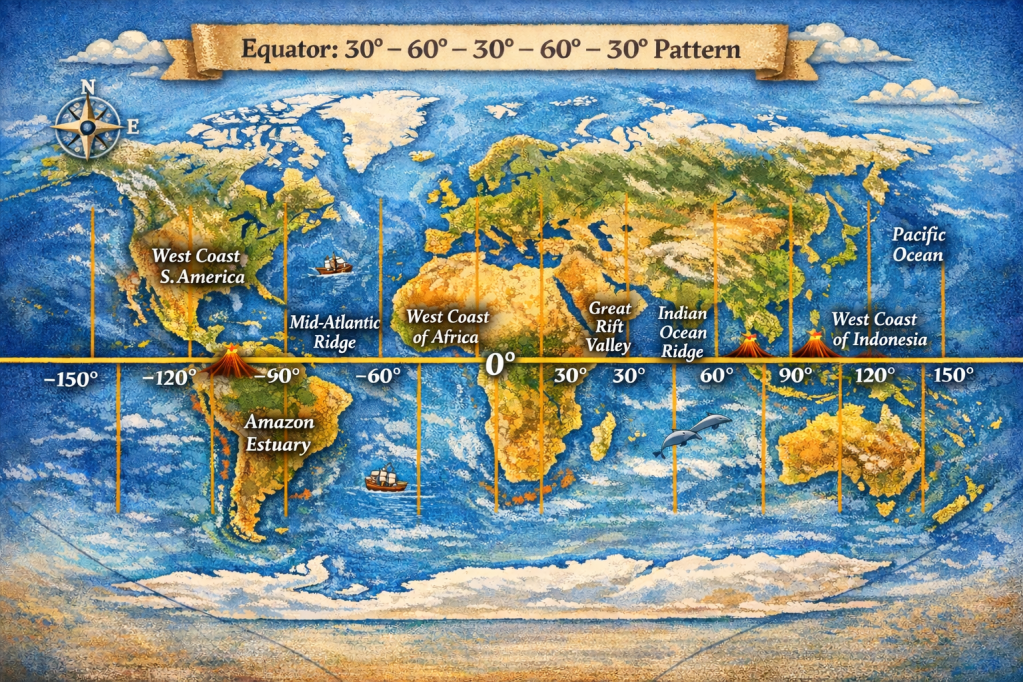
Look at a world map and focus only on one line: the equator. Now follow it from west to east.
What do you see?
South America spans about 30° – The Atlantic Ocean spans about 60°. If you see that — keep going, and now continue along the equator:
West coast of Africa → Great Rift Valley 30°
Great Rift Valley → Mid-Indian Ocean Ridge 60°
Mid-Indian Ridge → West coast of Indonesia 30°
West coast → East coast of Indonesia 30°
Pause. Look again.
What pattern do you get?
30° – 60° – 30° – 60° – 30° One more step. Now try something else.
Start at the east coast of Indonesia and trace the arc of the Ring of Fire all the way to the west coast of South America.
So what do you find?
You have now followed the equator across the globe. The question is simple: Do you see a pattern — or not?Is it:more regular than expected, or less? Just look at the map. And decide for yourself. The more accurate maps you use the better. Then we are back to a more scientific approach:
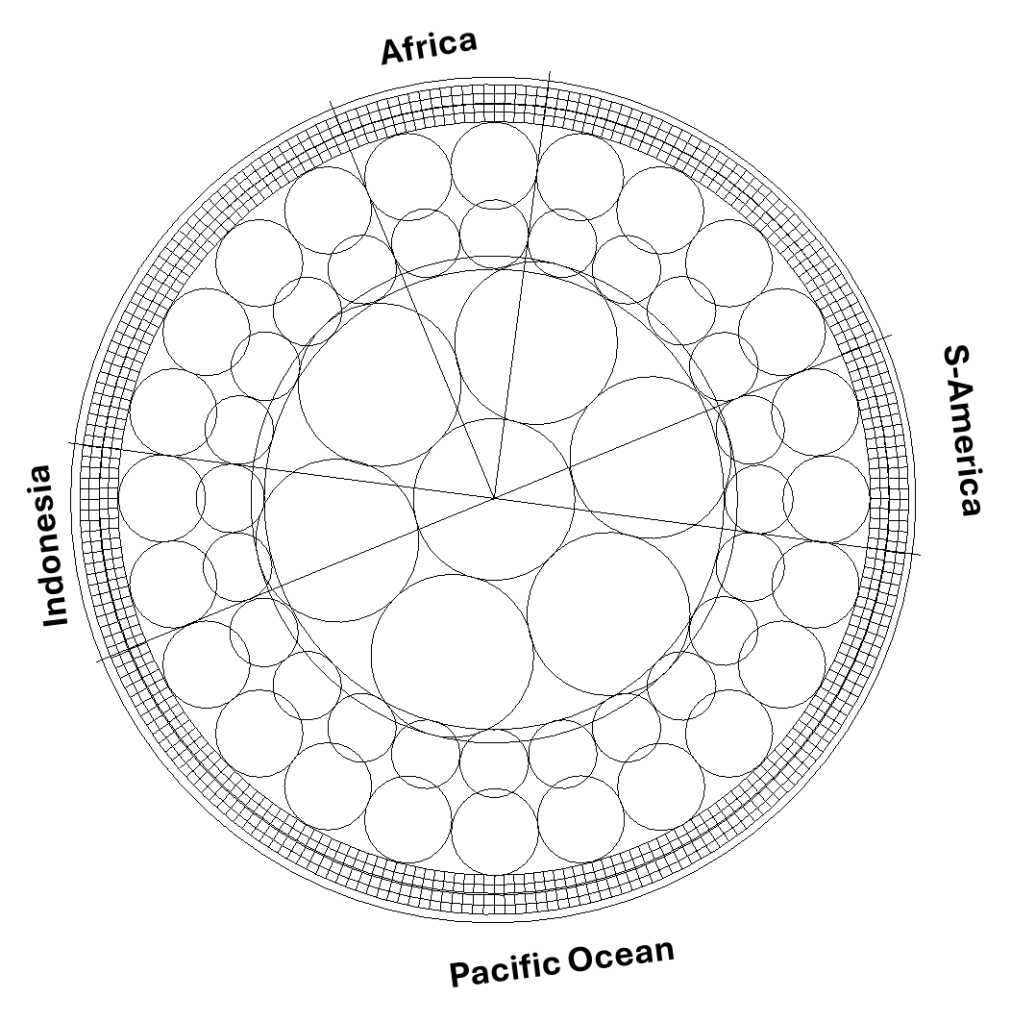
Section of Mantle Convection Rolls System within the Earth
Along the equator, a pattern like this should be expected, because convection within the Earth does not occur randomly but tends to organize itself within each layer. The internal layers of the Earth have been measured with considerable accuracy, and it is well established that the temperature gradient of the mantle is close to adiabatic. This implies conditions similar to those found near the base of the tectonic plates, at depths of around 120 km, where mantle material is relatively stable, and below that it becomes capable of slow flow. Laboratory experiments show that under such conditions, mantle-like material tends to form convection rolls with approximately equal height and width. From this, it is reasonable to expect that a regular pattern of this kind should emerge within the Earth.
This expectation corresponds closely with the observed distribution of continents and mid-ocean ridges along the equator. The equator is a special case, because it represents a zone of symmetry in relation to Earth’s rotation. The horizontal component of the Coriolis effect is effectively zero there, while to the north and south it acts in opposite directions. As a result, the equatorial region provides particularly regular physical conditions, making it a natural place to look for large-scale structural patterns.
A familiar demonstration is often used to illustrate rotational effects: water draining in a sink tends to rotate in opposite directions in the two hemispheres. This is frequently shown near the equator as a simple experiment. But this leads to a more fundamental question: if rotation causes opposite behavior on either side of the equator, what happens exactly at the equator itself, where these effects balance out? Accordingly, we can find a reason why continents and ocean floor sections have a special distribution exactly along the equator! It is The Equatorial 30° Mapped Fact of the World!
The internal energy flow of the Earth can be approached through a set of simple but physically meaningful preconditions that together form a coherent conceptual model.
The first precondition is that radioactive decay supplies an energy output comparable to the total heat flux emitted by the Earth. This assumption is supported by geochemical evidence suggesting that the abundance of radioactive isotopes—particularly uranium-238, thorium-232, and potassium-40—in primitive meteorites is broadly consistent with the inferred composition of the Earth. If so, radioactive decay could account for the entirety, of Earth’s present-day heat loss.
The second precondition is that the mantle is partially transparent to thermal radiation, particularly the radiation produced by these radioactive elements, along with the outer core. Under this assumption, a portion of the radiative energy generated within the mantle can propagate downward and be absorbed by the inner core. In this framework, the inner core is not merely a passive reservoir of residual heat, but an active participant in a dynamic energy exchange system.
Energy received by the inner core is then redistributed through convection within the outer core, which acts as an efficient transport mechanism. This convective motion transfers heat upward toward the mantle across the core–mantle boundary (CMB), a region that plays a critical role in coupling deep Earth processes. From there, heat continues to move through the mantle by a combination of convection and radiation, ultimately reaching the base of the lithosphere.
Within the tectonic plates, heat is transported toward the surface through conduction and localized magma flow, giving rise to volcanic and tectonic activity. In this way, the model provides a continuous pathway for energy: from radioactive sources, through radiative transfer and convection, to surface expression.
A central point of debate concerns the radiative properties of the mantle. Conventional models often assume that the mantle is largely opaque to thermal radiation, which limits the role of radiative heat transfer. However, this assumption remains uncertain, particularly under the extreme temperatures and pressures of the deep mantle. If the mantle is more transparent than typically assumed, radiative energy transfer could play a significantly large role in Earth’s internal energy budget.
Another debated issue is whether the inner core is growing over time. Some models suggest gradual solidification of the core, while alternative perspectives argue that the core maintains relatively stable proportions and temperature through long-term dynamic equilibrium. If such stability holds, it would support a model in which energy input—potentially via radiative transfer—is balanced by outward heat flow.
To explore the implications of this framework, convection rolls can be introduced into mantle layers as a simplified representation of large-scale flow. These structures provide a useful basis for comparison with observed surface patterns, such as tectonic plate boundaries, volcanic distributions, and heat flow variations. Preliminary comparisons, shown here, suggest that such models may reproduce certain large-scale features of the Earth’s surface, indicating that the approach is worthy of further investigation.
Basic convection rolls model, equatorial section
Conclusion
This holistic model proposes a testable alternative framework for understanding Earth’s internal energy flow. Its validity depends on key assumptions—such as the radiative transparency of the mantle and the long-term stability of the core—which can, in principle, be evaluated through observation, experiment, and modeling. The consistency between the mantle convection roll model and observed surface features has been rigorously tested here and shows strong agreement.
Here, a geometrically constrained, physics-motivated model for the large-scale convection architecture of Earth’s interior, is developed. The central objective is to show that the apparent complexity of surface geology can be understood as the surface expression of a comparatively regular interior system—one that is (i) consistent with the known physical behavior of convective flow and (ii) strictly constrained by geophysical measurements of Earth’s layered structure.
The method is intentionally bottom-up. It begins with measured layer thicknesses and a small number of physical principles, imposes a strict geometric requirement on how convection must occupy those layers, derives a three-dimensional convection-cell architecture, and only then (in Part II) compares the resulting predictions with surface observations such as fault systems, mid-ocean ridges, volcanic zones, and geothermal provinces. Iceland serves as a particularly powerful natural laboratory because multiple parts of the system intersect there.
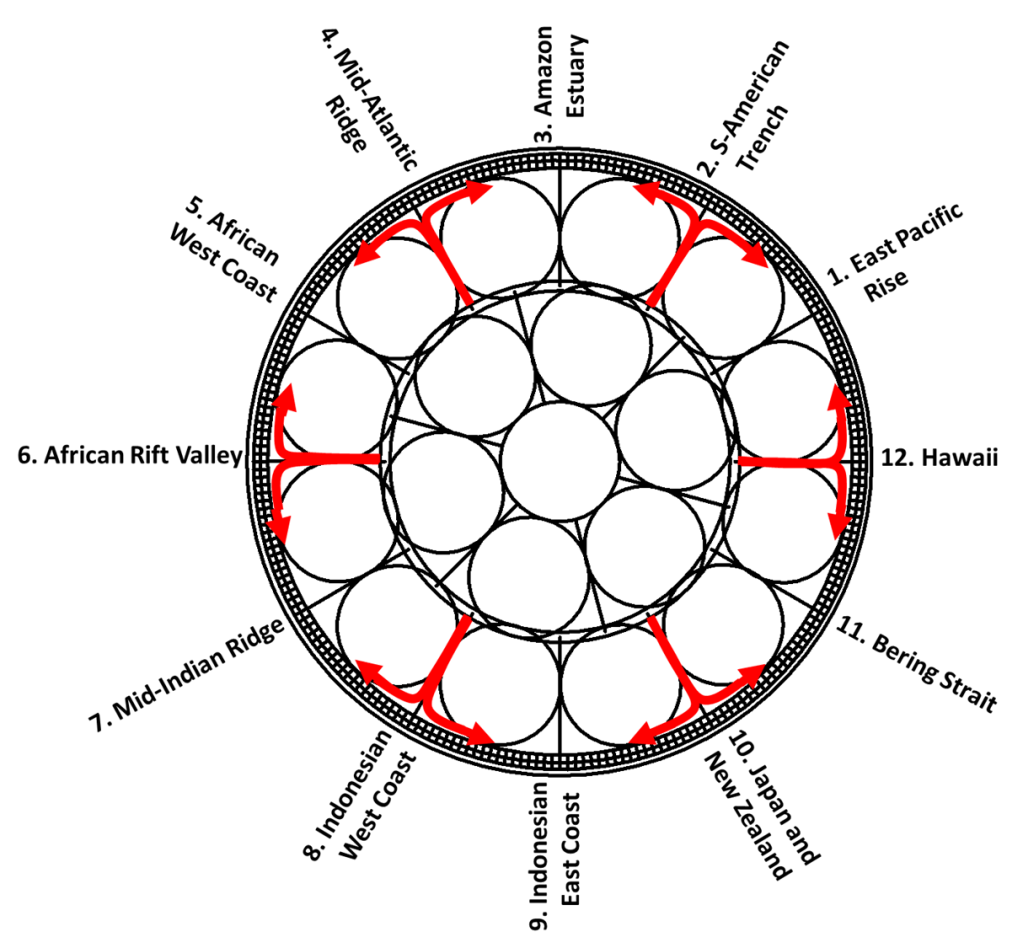
The 12 main division lines of the lower mantle convection rolls system.
A chain of implications:
Layering → Geometry Earth’s measured internal stratification defines fixed radial spaces that convection must occupy.
Physics → Cell proportions Rayleigh–Bénard convection under balanced conditions favors rolls with comparable vertical and horizontal dimensions.
Exact filling → Discrete structure When layers are required to be filled exactly by RB roll sections, characteristic cell sizes and integer counts emerge.
Rotation → Curvature Earth’s rotation constrains the horizontal planform of flow, producing systematic curvature and latitudinal organization.
Continuity → Intersection zones Global circulation requires geometrically defined zones where different roll families and layers connect smoothly.
Petrology → Two-layer interpretation The resulting upper-mantle structure naturally accommodates two chemically distinct source regions, consistent with MORB and OIB.
Heat transport → Focused pathways Convection, conduction, radiation, and focused melt transport together explain how a regular interior system can produce localized surface volcanism.
The guiding premise throughout Part I is that regularity is the default expectation for a slowly evolving, rotating convective system operating over geological timescales inside a nearly spherical body.
Background
When Earth’s internal layers—defined seismologically—are drawn to scale, their thicknesses exhibit a degree of regularity that invites geometric testing. The working hypothesis is that this regularity is not accidental: convection within the Earth organizes itself in a way that fills the available radial space efficiently and repeatedly.
The model does not introduce new physics. Instead, it organizes existing measurements within a coherent geometric and physical framework, extending classical ideas about mantle convection and plate motion in the conceptual tradition of Sir Arthur Holmes and Harry Hess, besides Alfred Wegener and others. The novelty lies in enforcing internal consistency across all layers simultaneously.
The governing preconditions are deliberately minimal:
Thermal forcing: sustained heat flow requiring convection in the mantle and outer core.
Rotation: Earth’s spin, introducing Coriolis constraints on horizontal flow.
Measured stratification: seismically determined depths of major boundaries and transition zones.
If convection has operated for billions of years in a thick, relatively homogeneous mantle, logic suggests that the system approaches a balanced, quasi-steady organization. Under such conditions, repetitive structures are expected rather than arbitrary ones.
Radial geometry and the primary constraint
The central requirement of the model is simple and strict:
Each convecting layer must be exactly filled by sections of Rayleigh–Bénard convection rolls, without adjustment of dimensions. The roll geometry is determined solely by this requirement and by the physical tendency of RB convection toward comparable vertical and horizontal length scales.
No internal length scale is assumed in advance. Instead, the measured thicknesses of the layers define the available space, and the roll dimensions must adapt to that space under the constraint of exact geometric filling. The geometry then follows the rotational plane of the Earth, starting with the equatorial plane where convection flow and centrifugal force coincide in one plane.
To make the geometry explicit, the conventional “surface-down” description of Earth’s structure is reformulated as a center-out radial system. This allows roll sections to be constructed directly within each layer. When this is done, a regular packing of roll sections emerges that simultaneously satisfies multiple layer boundaries, including the core–mantle boundary region and the upper mantle transition near ~410 km.
The key point is logical rather than numerical: when a single roll geometry fits several independent, measured layers without tuning, the probability of coincidence becomes small. The consistency itself becomes the result.
Upper mantle structure and the 410 km and 670 km discontinuities
Attention then shifts to the part of the Earth most directly coupled to surface geology: the upper mantle and asthenosphere.
Two boundaries define the active convective domain beneath tectonic plates:
an upper boundary near ~120 km, where behavior shifts from conduction-dominated lithosphere to convection-dominated asthenosphere;
a lower boundary near ~410 km, marking the top of the large lower-mantle convection system in this framework.
This creates approximately 290 km of vertical space. When exact RB roll filling is imposed on this interval, simple trigonometry shows that only certain discrete arrangements are possible. A particularly robust solution yields 240 convection cells around the globe in the upper layers, corresponding to a longitudinal spacing of 1.5°.
This number is not arbitrary. It is constrained by symmetry, by divisibility relative to the deeper system, and by the requirement that upper and lower systems nest coherently. The result is a hierarchical structure: large rolls below and smaller rolls above.
The interval between ~410 km and ~670 km is found to accommodate additional roll systems, also with a longitudinal spacing of 1.5°, nested within the larger cells. These secondary systems do not replace the primary structure but supplement it, allowing vertical and horizontal circulation to remain continuous.
Horizontal geometry, rotation, and curvature
With the vertical structure established, the model turns to horizontal geometry. In a rotating system, convection cannot remain rectilinear. The Coriolis effect causes flow paths to curve in systematic ways.
Using inertial-flow reasoning, the characteristic horizontal scale of unconstrained motion on a rotating Earth is of the order of Earth’s radius. To represent this geometry, a square latitude–longitude grid is used as a drawing space, with the understanding that it is a mathematical convenience rather than a physical projection.
Imposing two constraints—
fixed separation of roll boundaries at the equator, and
latitude-dependent horizontal scaling proportional to 1 / cos φ—
leads to a compact geometric condition whose solution identifies a characteristic latitude near 32° N and S. Circles centered near these latitudes reproduce the required horizontal dimensions while remaining consistent with rotational physics.
Earth is not a perfect sphere, but a geoid. Because curvature deviations are not uniformly distributed with latitude, the operational center is taken as approximately 32.0°, which is makes geological-scale predictions possible.
The resulting map-level representation consists of families of circular roll boundaries spaced at 1.5° intervals, supplemented by polar roll families that connect smoothly to the hemispheric system.
Importantly, the circle equations themselves are dimensionless. Angular degrees enter only when the geometry is interpreted on Earth’s surface.
MORB and OIB as expressions of a two-layer system
The geometric framework naturally accommodates a petrological distinction long recognized at the surface: MORB versus OIB.
In the model, these correspond to two vertically stacked convection layers within the upper mantle. The upper layer supplies MORB to mid-ocean ridges, while the lower layer samples deeper or compositionally distinct material consistent with OIB.
Horizontal circulation is described as linked semicircular segments: material travels along a semicircle in one layer and returns along a complementary semicircle in the other, forming a closed loop. This architecture allows continuous circulation while limiting mixing—precisely what is required if MORB and OIB remain distinct over geological time.
When the derived circle families are plotted on a world map, individual boundaries often align with major geological structures. These alignments are not assumed in advance; they become testable predictions.
Heat transfer, radiation, and focused pathways
While convection is the dominant mode of heat transport, conduction and radiation also play roles. At high temperatures, mantle materials may become increasingly transparent to thermal radiation, effectively enhancing internal heat redistribution.
In this framework, radiative transfer allows heat generated in upper layers—where radioactive elements are concentrated—to contribute to deeper thermal budgets, with convection redistributing that energy upward again.
At the boundaries between convection cells, focused upward melt transport is proposed to occur via Munroe-type effects, where geometric and thermal focusing produce narrow, persistent conduits. These conduits provide a mechanism by which a broadly regular convection system can generate sharply localized volcanism and geothermal anomalies.
Intersection zones and global continuity
A global circulation system must close smoothly. This requires intersection zones where different roll families and layers connect without violating rotational constraints.
Two principal types are identified:
Mid-to-high latitude intersections (~60.7°–67.3°), where hemispheric and polar roll systems meet. Near ~64°, roll directions become tangent, allowing exchange without disrupting curvature.
The equator, where the Coriolis effect changes sign. Here, flow must reverse curvature or transfer between layers, imposing strong geometric constraints that may explain large-scale equatorial regularities.
In these zones, effective layer doubling or reorganization may occur, producing greater structural complexity. Iceland lies within such an intersection region, explaining its unusually rich geological expression.
Integrated logic
The model proceeds as a single logical construction:
measured stratification defines the available space,
RB convection physics constrains roll proportions,
and extended heat-transfer mechanisms explain focused surface activity.
The outcome is a coherent, testable three-dimensional framework. It produces explicit geometric predictions—locations, orientations, and characteristic spacings—that can be confronted directly with geological and geophysical observations.
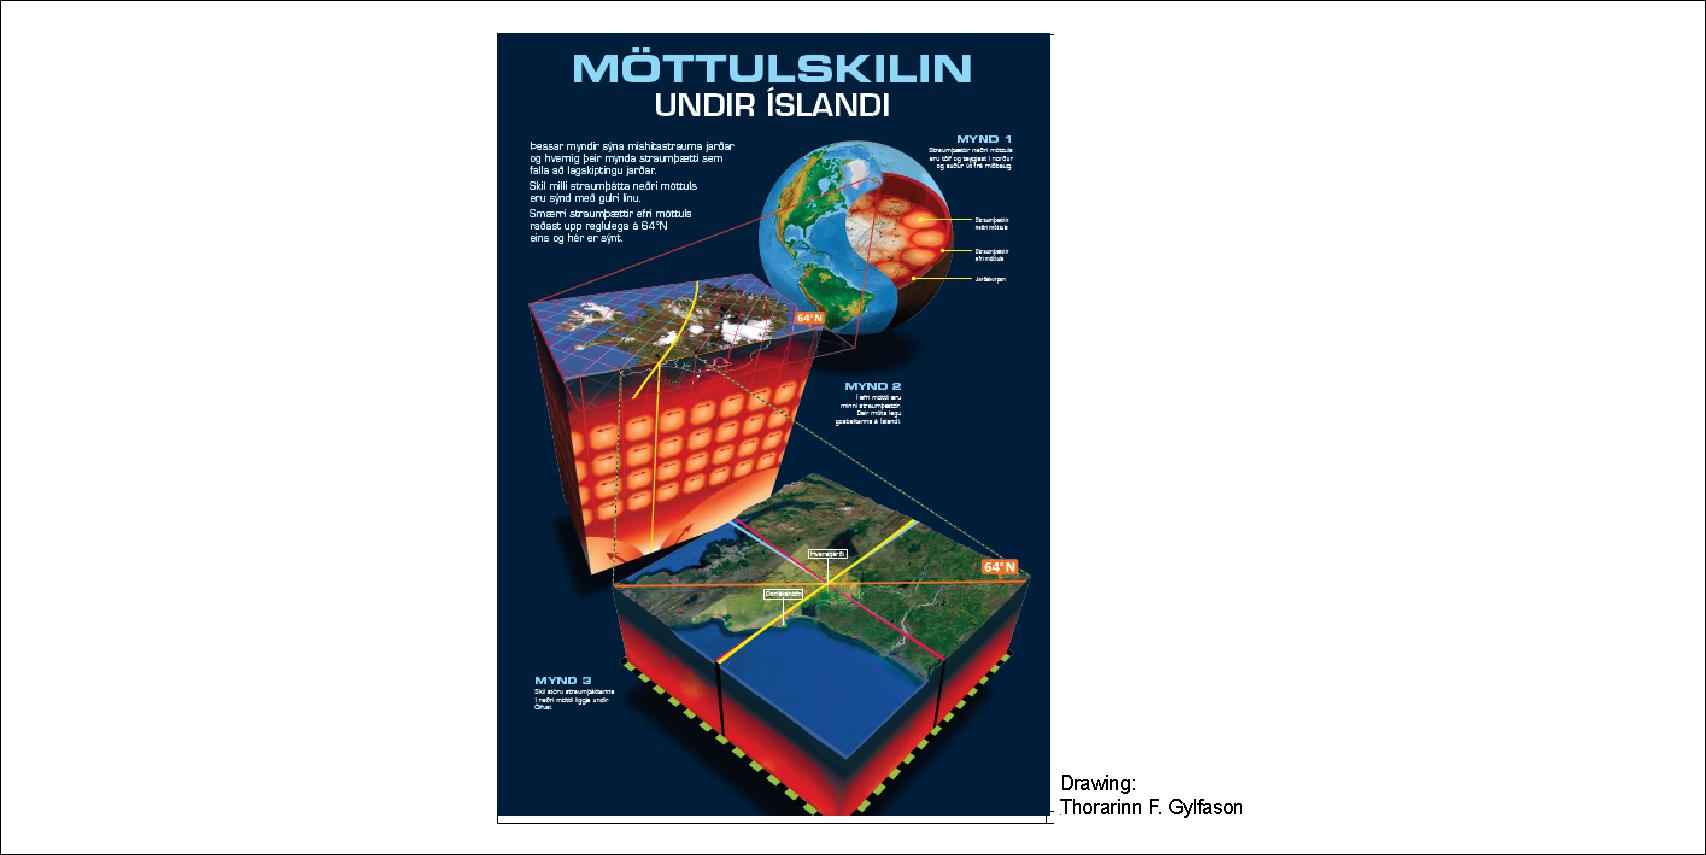
There are many ways in which Iceland can be meaningfully compared with the mantle convection-rolls model. When viewed from a holistic, bird’s-eye perspective, the pattern of the continental shelf, the mid-ocean ridges, and the position of Iceland’s stratovolcanoes together reveal a coherent geological structure. To understand this fully, it is necessary to recognize both the location and the function of the major convection rolls operating beneath Iceland. In this model, the rolls do not have fixed “axes”; instead, they sway according to their governing equations. Therefore, the true geological significance lies in the division boundaries between adjacent rolls. These boundaries, when projected through the mantle and lithosphere, naturally delimit Iceland’s volcanic zones and help explain their geometry.
Convection rolls arrangement at 64°N
Although Iceland’s brittle lithosphere is thicker than that of the surrounding oceanic crust, this is not a primary control on the island’s unusual activity. The key factor is the complex intersection zone where two long-distance convection-roll systems meet—one extending northward from equatorial regions and another extending southward from high northern latitudes. The interaction of these systems forms an overlapping polygonal pattern beneath Iceland, creating N–S and E–W patterns, such as the South Iceland Seismic Zone and the North Volcanic Zone. This convergence of roll-division boundaries generates the necessary preconditions for Iceland’s exceptional volcanic and geothermal behavior: enhanced mantle temperatures, increased melt supply, localized geothermal intensification, and mechanically weakened pathways that sustain the divergent boundary on land.
Within this framework, specific observations become clearer. Many of the best known geothermal areas closely follow the division line of the convection roll extending from the Reykjanes Ridge beneath the island. Yet they are not controlled by this single division line alone—the overlapping boundaries of other convection rolls also play a defining role. Several major geothermal zones lie precisely where these secondary roll-boundaries intersect the Reykjanes line. This is evident at Hveravellir, located where a northern roll-boundary crosses the central Icelandic system, and at Húsavík’s GeoSea geothermal field, which aligns with another such crossing point. Recent discoveries reinforce this pattern: the high-temperature system near Vaðlaheiðargöng (now supplying hot water to the Forest Lagoon by Akureyri) and the new geothermal resources near Keflavík both lie directly along intersecting convection-roll boundaries exactly as the model predicts. Other geothermal areas, such as at Grímsvötn and Kverkfjöll, are found along a parllel line, 3° east of the eastern margin of the said eastern roll of the Reykjanes Ridge convection rolls pair, also at crossings with other division lines of different depth. Such examples show that geothermal activity in Iceland is not random nor solely linked to one major upwelling line, but is instead the integrated surface expression of multiple interacting mantle-roll boundaries.
The volcanic zones can likewise be subdivided into natural segments that align with roll boundaries, and the tectonic drift vectors correspond closely with the grid formed by the convection-roll divisions. This allows a physically meaningful line to be drawn representing the true boundary between the North American and Eurasian plates—one that reflects deep-mantle dynamics rather than only surface expressions. Even the smaller peripheral volcanic zones align with the edges of adjacent polygons, occupying precisely the distances expected from secondary roll-boundary influences. In fact, all deeper rooted details of Iceland’s tectonic, geothermal, and volcanic structure can be understood by comparing it with the deep-mantle convection-roll system, which provides a unified and dynamically consistent model for interpreting the island’s geological complexity.
There is a clear and well-documented difference between the average dip of subduction zones that face east (about 27.1°) and those that face west (about 65.6°). This asymmetry has long intrigued geoscientists. Traditional explanations emphasize variations in the age and density of the subducting lithosphere—older seafloor is denser and therefore subducts at a steeper angle.
However, the Mantle Convection Rolls Model introduces an additional and complementary mechanism: the effect of Earth’s rotational velocity on the descending slab. Velocity of the subducting slab does not matter here, only the difference in rotational energy at different depths. We do not see how the tectonic plates move, but that does not mean we sould neglect the relevant calculations. In this case, calculating the difference is very simple.
Rotational Velocity and Kinetic Energy Loss
As the slab descends roughly 660 km—about one-tenth of Earth’s radius—it gradually loses rotational velocity, as the circle at surface is obviously longer then the lower circle. It therefore involves a significant kinetic-energy transfer to the surrounding mantle. If we set Earth’s radius as 1, the radius at 670 km depth is ≈ 0.9. At the equator, the difference in kinetic energy between these levels can be estimated as rotational energy at surface subtracted by rotationa energy at 670 km depth:
The result, 0.2, means that about 20% of the slab’s kinetic energy is dissipated while moving from the surface to the transition zone. Considering that the tangential velocity at the equator reaches about 1 ,674 km h⁻¹, a 20% reduction represents an immense energy transfer to the surrounding material. Imagine what happens to one cubic kilometer of slab after it loses 20% of its kinetic energy with the velocity of 1 ,674 km h⁻¹. Should it have no effect at all, or should it alter the dip of the descending slab? Of course the dip is affected by this transfer of energy, and it fits very well to the difference between the east and west of the Pacific Ocean.
The aggregate effect of this energy loss manifests differently on opposite sides of the Pacific. Along the eastern margins, the energy dissipation induces compressional pressure between converging plates; along the western margins, it produces a tensional or pulling effect. These opposing mechanical environments contribute to the observed difference in average slab dip: approximately 46° overall, with west-oriented subduction averaging near 65° and east-oriented near 27° (described in an essay by Doglioni & Panza, 2015).
Geometric Representation
This relationship can be illustrated geometrically. If the rotational velocity at Earth’s surface is represented as u = 1 and at 660 km depth as u = 0.9, two similar triangles can be drawn to represent eastward and westward subduction. The short side of each triangle—the horizontal gap between real flow (red) and the hypothetical no-rotation line (black)—corresponds to the observed angular difference. These geometric relations visually express how differential rotational velocity produces the characteristic east–west asymmetry of slab inclination. The simple drawing below shows the average difference.
Equatorial Symmetry and Mantle Roll Alignment
The same principle extends horizontally. The main division points of the equator coincide strikingly with the division boundaries of modelled lower-mantle convection rolls, which are spaced 30° apart. When subduction zones located exactly 180° apart on the equator are compared—most notably those of South America and Indonesia—their symmetry becomes evident. The position of these two trenches opposite each other can by no means be said to be just a coincidence.
This has of course been mapped in detail for each subduction zone. In turn, those subduction zones show identical, although mirrored, deviation from true north. This symmetry can be explained by referring to the mantle convection rolls model. The fact that not only position, but also deviation from north is identical can not be said to be just a coincidence.
Integration Within the Mantle Convection Rolls Model
According to the Mantle Convection Rolls Model, the slab ultimately enters a ductile, convecting mantle where geophysical conditions are balanced. The difference in slab dip between east- and west-oriented subduction zones thus arises from the rotational-kinetic interaction between the descending plate and the mantle framework through which it moves.
Horizontally moving mantle material is similarly governed by the rotating geoid, producing predictable deviations from straight-line flow that define the roll-like geometry of convection cells. The vertical and horizontal components of this system are dynamically linked—both shaped by the same rotational gradients that influence slab inclination.The Missing Correlation Between Seafloor Age and Slab Dip
If slab dip were controlled primarily by the age of the subducting seafloor, one would expect a clear correlation between older, denser lithosphere and steeper subduction angles. However, such a relationship is not observed—particularly along the western margin of the Pacific Ocean.
For example:
The Mariana Trench, one of the deepest and steepest subduction zones on Earth, indeed involves an old oceanic plate (>150 million years). But if seafloor age were the decisive factor, then all regions subducting comparably old crust should exhibit similar dip angles—which they do not.
Along the Japan Trench, the subducting Pacific Plate is also very old (130–140 million years), yet its dip is far shallower in many segments, especially near Honshu and Hokkaido, where the slab inclination decreases dramatically toward the northeast.
Conversely, some younger lithosphere—such as that near Tonga or New Britain—subducts at extremely steep angles, contradicting any simple “old plate = steep dip” rule.
In other words, no systematic correlation exists between the age of the descending seafloor and the dip angle of subduction along the western Pacific. This observation directly contradicts the density-driven model, while strongly supporting a dynamic explanation based on Earth’s rotational velocity gradients.
The striking and consistent difference between eastward- and westward-dipping slabs, on the other hand, reveals a clear global pattern that matches the expected distribution of kinetic energy within the rotating mantle.
Why Has This Explanation Been Overlooked?
It may appear surprising that such an evident physical relation—between Earth’s rotation and slab dip—has not been explicitly emphasized before. The reason may lie in the timescales involved.
When a unit volume of lithosphere, say one cubic kilometer of slab, moves downward by 100 km, it inevitably tends to drift eastward relative to the overlying surface because its rotational velocity decreases with depth. The motion is fully deterministic: the deeper the material sinks, the greater its lag relative to the surrounding mantle at that depth.
Yet this motion unfolds extremely slowly—so slowly that, within the human timeframe or even during the lifespan of an oceanic plate, the effect seems negligible. Over millions of years, however, this cumulative eastward drift becomes geophysically significant.
It alters the balance between horizontal traction and vertical descent, subtly controlling slab geometry. Because geoscientific models typically focus on instantaneous plate velocities rather than rotational energy differentials, the long-term kinematic consequences of Earth’s rotation have been largely overlooked or treated as negligible.
Thus, the explanation first formulated here appears novel not because it contradicts known physics—but because it applies fundamental physical reasoning (rotational mechanics) across a geological timescale that previous models rarely considered in full.
Conclusion
The consistent difference in dip angle between east- and west-oriented subduction zones can therefore be interpreted as a manifestation of Earth’s rotational dynamics coupled with the internal organization of mantle convection rolls. This integrated view connects global rotation, energy dissipation, and large-scale convection geometry into one coherent framework, offering an explanation that aligns observed slab asymmetry with measurable physical principles.
The geometry of subduction zones—both in terms of dip angle and global distribution—reflects the interaction between Earth’s rotation, kinetic energy dissipation, and large-scale mantle convection rolls.The absence of any correlation between seafloor age and slab dip across the western Pacific undermines the traditional density-based explanation. Instead, the consistent and global asymmetry between eastward and westward subduction aligns naturally with the physics of a rotating planet, where angular momentum and kinetic energy vary systematically with depth and latitude.What may initially appear as asymmetric behavior of tectonic plates can thus be understood as a predictable consequence of rotational mechanics acting within a viscous, convecting mantle—an effect long hidden simply because of its subtlety and timescale.