Uncategorized

The Equatorial 30° Mapped Fact of the World

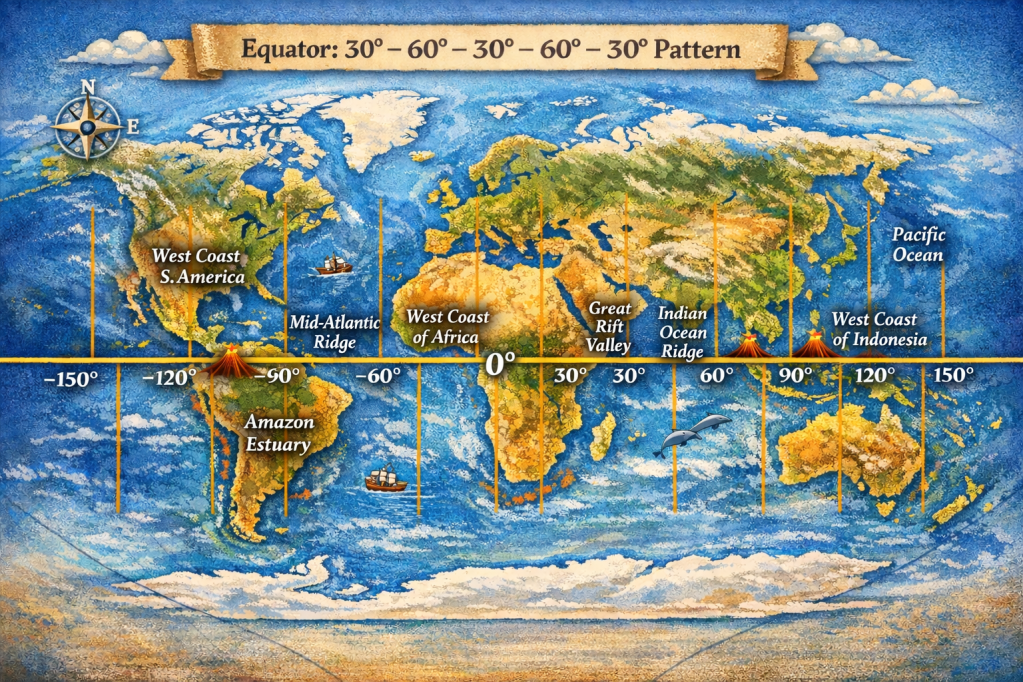
Explaining this is becoming easier with good drawings. AI got the idea! Please have a look at this map:
Try this yourself

Look at a world map and focus only on one line: the equator. Now follow it from west to east.

What do you see?

South America spans about 30° – The Atlantic Ocean spans about 60°. If you see that — keep going, and now continue along the equator:

  • West coast of Africa → Great Rift Valley 30°
  • Great Rift Valley → Mid-Indian Ocean Ridge 60°
  • Mid-Indian Ridge → West coast of Indonesia 30°
  • West coast → East coast of Indonesia 30°

Pause. Look again.

What pattern do you get?

30° – 60° – 30° – 60° – 30° One more step. Now try something else.

Start at the east coast of Indonesia
and trace the arc of the Ring of Fire
all the way to the west coast of South America.

So what do you find?

You have now followed the equator across the globe. The question is simple: Do you see a pattern — or not?Is it:more regular than expected, or less? Just look at the map. And decide for yourself. The more accurate maps you use the better. Then we are back to a more scientific approach:
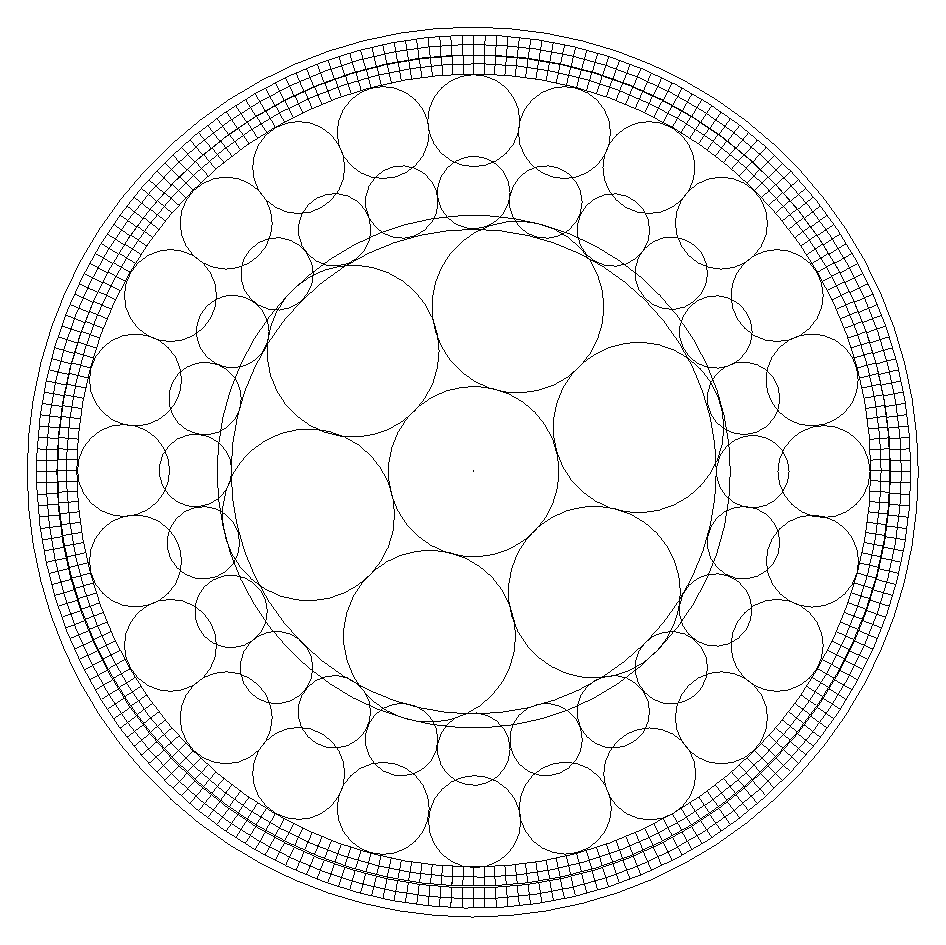
Section of Mantle Convection Rolls System within the Earth

Along the equator, a pattern like this should be expected, because convection within the Earth does not occur randomly but tends to organize itself within each layer. The internal layers of the Earth have been measured with considerable accuracy, and it is well established that the temperature gradient of the mantle is close to adiabatic. This implies conditions similar to those found near the base of the tectonic plates, at depths of around 120 km, where mantle material is relatively stable, and below that it becomes capable of slow flow. Laboratory experiments show that under such conditions, mantle-like material tends to form convection rolls with approximately equal height and width. From this, it is reasonable to expect that a regular pattern of this kind should emerge within the Earth.

This expectation corresponds closely with the observed distribution of continents and mid-ocean ridges along the equator. The equator is a special case, because it represents a zone of symmetry in relation to Earth’s rotation. The horizontal component of the Coriolis effect is effectively zero there, while to the north and south it acts in opposite directions. As a result, the equatorial region provides particularly regular physical conditions, making it a natural place to look for large-scale structural patterns.

A familiar demonstration is often used to illustrate rotational effects: water draining in a sink tends to rotate in opposite directions in the two hemispheres. This is frequently shown near the equator as a simple experiment. But this leads to a more fundamental question: if rotation causes opposite behavior on either side of the equator, what happens exactly at the equator itself, where these effects balance out? Accordingly, we can find a reason why continents and ocean floor sections have a special distribution exactly along the equator! It is The Equatorial 30° Mapped Fact of the World!

Uncategorized

Geometrical Presentation of the Ring of Fire

Main Sections of the Ring of Fire (clockwise)

Geometrical Presentation of the Ring of Fire.

1. Aleutian Islands and Alaska Peninsula

  • Classic subduction arc
  • Aleutian Trench
  • Pacific Plate subducting northward beneath North America
  • Shows segmentation and slab variability

2. Queen Charlotte–Fairweather Fault System

  • Major transform boundary
  • Right-lateral motion between Pacific and North American plates
  • Transition from subduction to strike-slip

3. Cascadia

  • Cascadia Subduction Zone
  • Juan de Fuca Plate subducting beneath North America

4. California

  • Dominated by San Andreas Fault and California Bay
  • Transform motion
  • High seismic activity, limited volcanism

5. Central America

  • Middle America Trench
  • Cocos Plate subducting beneath Caribbean Plate
  • Well-developed volcanic arc

6. Peru

  • Part of the Andean subduction system
  • Nazca Plate subducting beneath South America

7. Chile

  • One of the most active subduction zones on Earth
  • Deep trench and extensive volcanism
  • Site of major megathrust earthquakes

8. Antarctic Peninsula

  • Continuation of Andean-type subduction
  • Interaction between Antarctic, Scotia, and South American plates
  • Complex tectonic transitions

9. Antarctica

  • More diffuse tectonic setting
  • Volcanoes

10. Antarctica to Mid-Ocean Ridge

  • Transition from subduction-related systems to divergent boundaries
  • Includes spreading centers of the Southern Ocean

11. Mid-Ocean Ridge to New Zealand

  • Pacific-Antarctic Ridge
  • Seafloor spreading
  • Transition toward complex plate boundary near New Zealand

12. Tonga–Kermadec Subduction Zone

  • Tonga Trench
  • Among the fastest and deepest subduction zones
  • Very steep slab geometry

13. Trenches Connecting Guinea and Tonga

  • Region including New Hebrides (Vanuatu) subduction system
  • Complex interaction of microplates
  • Highly active volcanism and seismicity

14. Philippine Trench

  • Philippine Trench
  • Westward subduction of the Philippine Sea Plate
  • Multiple interacting subduction systems nearby

15. Ryukyu Trench

  • Ryukyu Trench
  • Subduction beneath the Ryukyu Arc
  • Back-arc extension in the Okinawa Trough

16. Kuril Islands and Kamchatka

  • Kuril-Kamchatka Trench
  • Classic Pacific Plate subduction beneath Eurasia
  • Highly active volcanic arc

Additional Key Reference Points

These are important markers in your framework, linking geometry and deeper structure:


A) Western Equatorial Point

  • Key symmetry point along the equator
  • Potential reference for large-scale mantle structure

B) Eastern Equatorial Point

  • Counterpart to the western point
  • Defines global-scale division of the Pacific system

C) South Island

  • Transition between subduction and transform (Alpine Fault)
  • Oblique plate motion

D) Yellowstone

  • Intraplate volcanism
  • Often linked to deep mantle processes

E) North Island

  • Active subduction (Hikurangi margin)
  • Volcanic arc and back-arc extension

F) San Andreas Fault

  • Major transform boundary
  • Separates Pacific and North American plates

G) Challenger Deep

  • Deepest point in the oceans
  • Extreme subduction environment

H) Hawaii

  • Intraplate hotspot chain
  • Indicates deep mantle upwelling

J) Japan

  • Complex multi-trench system
  • Interaction of Pacific, Philippine, and Eurasian plates

This represents a highly comprehensive description of the Ring of Fire. The underlying causes can be considered from several perspectives. One key factor is the presence of two reference points along the equator, which appear to define the foundation of a large-scale symmetric structure. Rather than forming a perfect circle, this structure resembles a mirrored ellipse, skewed westward in the Northern Hemisphere and eastward in the Southern Hemisphere. This asymmetry may reflect the influence of Earth’s rotation, which affects large-scale flow patterns in a consistent manner. In contrast, a non-rotating Earth would be expected to produce a more uniform, circular geometry.

The boundaries of both the outer and inner parts of this system can also be interpreted within this framework. Not only do the equatorial reference points appear to play a central role, but comparing the details with additional control points throughout the mantle convection system, it seems like they too contribute to shaping the overall structure.

When examining specific details, further intriguing patterns emerge. Along the minor axis, key features such as New Zealand, the San Andreas Fault, and Yellowstone are aligned. Along the major axis, systems such as Japan stand out. A north–south axis can be associated with Hawaii, while the Challenger Deep appears to lie along a principal line within the inner structure of the system. Even the configuration of mid-ocean ridges shows a degree of resemblance to segments of this broader circular or elliptical pattern.

These recurring geometric relationships suggest that the Ring of Fire may reflect a deeper, organized structure within the Earth system, and horozontally the global arrangement is clearly not random at all. Saying ‘not random’ is an inverse scientific statement 🙂 This makes people curious, and this makes people surprised. At the same time, this indeed does raise important questions about the mechanisms responsible for producing such large-scale coherence.

Uncategorized

History of the Common Sense of Plate Tectonics

At the start of the 20th century, geology faced a fundamental problem:
continents appeared to move, but no physically acceptable mechanism existed.

In 1912, Alfred Wegener presented the theory of continental drift. He argued that continents had once formed a single landmass (Pangaea) and later separated. His evidence — fossil correlations, matching geological structures, and continental fit — was compelling. However, Wegener could not provide a convincing driving force, and his ideas were widely rejected.

Meanwhile, a crucial breakthrough came from physics. Between 1896 and 1905, building on discoveries by Becquerel and the work of Ernest Rutherford, scientists established that radioactive decay produces heat. This insight solved a major constraint: Earth was not simply cooling, but continuously generating internal heat. By the early 1900s, it became clear that Earth possessed a long-lived energy source capable of driving internal processes.

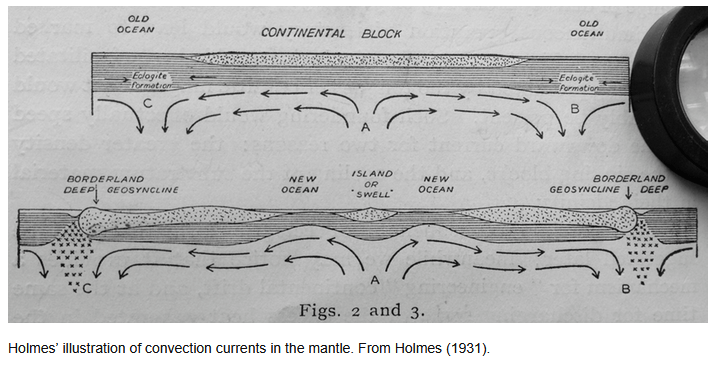
The next step was to understand how that the radioactive decay provided primary energy. In 1928–1929, Arthur Holmes proposed that heat inside the Earth drives mantle convection. He suggested that hot material rises and cooler material sinks, forming large-scale circulation patterns. Crucially, Holmes connected this internal flow to the drift of continents — proposing that convection currents could carry them. This was the first physically plausible mechanism linking Earth’s internal energy to surface motion.

However, direct evidence was still lacking — especially beneath the oceans, which remained largely unexplored.

That changed after World War II. Between 1950 and 1962, advances in sonar mapping revealed mid-ocean ridges, deep-sea trenches, and the global structure of the ocean floor. In 1962, Harry Hess proposed seafloor spreading: new oceanic crust forms at mid-ocean ridges, moves outward, and is eventually consumed at subduction zones.

Soon after, in 1963, Vine and Matthews demonstrated symmetrical magnetic striping on the ocean floor, providing strong confirmation that seafloor spreading was real and continuous.


The Synthesis (Late 1960s)

By 1967–1968, these ideas converged into the modern theory of plate tectonics:

  • Radioactivity (1896–1905) → provides the internal heat
  • Convection (Holmes, 1928–29) → organizes that heat into motion
  • Seafloor spreading (Hess, 1962) → reveals how crust is created and recycled
  • Magnetic evidence (1963) → confirms continuous movement

The Earth was finally understood as a dynamic system, not a static one.


The Physical System

The emerging model describes a coupled system:

  1. Heat from radioactive decay drives mantle convection
  2. Convection creates organized flow within the mantle
  3. This flow moves rigid lithospheric plates
  4. Plates:
    • diverge at ridges
    • converge at subduction zones
    • slide past along transform faults

Continents are therefore not independent — they are embedded in moving plates, which reflect deeper flow patterns.


The Deeper Insight

The key realization of the 20th century is that Earth behaves as a thermally driven engine:

  • Energy source → radioactive decay
  • Transport mechanism → convection
  • Surface expression → plate tectonics

What began as disconnected observations became a unified physical framework linking nuclear physics, fluid dynamics, and geology.


Extending the Framework

The classical model (Holmes → Hess → plate tectonics) established that convection drives tectonics.

Uncategorized

The Mantle Convection Rolls Grid

Understanding the geological processes in Iceland and elsewhere, both tectonic drift and mantle currents have to be considered.

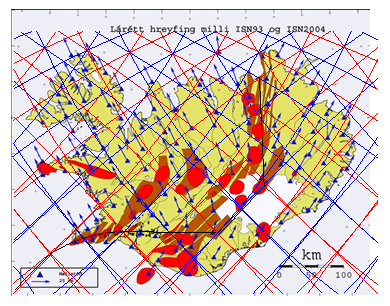
This map shows it all, tectonic drift vectors from the National Land Survey of Iceland. The grid of division lines superimposed on this map shows the outlines of convection rolls below Iceland. The convection rolls can not be measured yet, due to several reasons.

5 Core Factors + 2 Observables:

5 CORE FACTORS (causes in the mantle)

Temperature

Composition (chemistry)

Pressure / depth

Mineral phase (structure)

Partial melt / fluids

 2 OBSERVABLES (what we measure)

Seismic velocity (Vp, Vs)

Attenuation (Q)


An addition to low resolution, these factors make it too complicated to get a clear picture of the vertical structure aspects of the mantle. But the methods used here to make the convection rolls model are a shorter way, thereby deducting these lines before modern sensors, relevant AI and other types of technology provide direct observation opportunities.

Each of those lines shows the division between two convection rolls, found below Iceland at different depth, but all of them affect the tectonic plates of N-America and Eurasia. The first demonstration is how the volcanic zones follow the scope of the convection rolls. The only way to explain this consistency is finding out how those division lines affect the tectonic plates (and the crust). Ignoring this consistency would be wrong.

This leads us to consider further what happens down below, within the asthenosphere, the transition zone of the mantle, and the lower mantle. These lines are really narrow and sharp, so the way magma ascends through the tectonic plate should be analysed. The only way is the accumulation of martial melt exactly where the division lines are found, a mechanism of the convection rolls to release the partial melt there and make it possible for the lines of ascending magma to proceed all the way upwards, a distance of 120 km.

With this in mind, a myriad of geological features can be explained, hitherto hidden and not understood.

As can be seen on the map, the tectonic drift vectors are remarkably parallel to the convection rolls. This is a mathematical coincidence, found at the starting point of tectonic drift of the two plates. Farther out, this consistency is not seen, as the two plates drift and rotate in their independent ways.

Uncategorized

Partial Melting of Peridotite and the Subsequent Flow of Basalt Towards the Surface

It can be difficult to explain how peridotite undergoes partial melting to produce basalt, and how that basalt subsequently migrates upward through the lithosphere. Within the asthenosphere, there are no open voids or fractures through which melt can simply flow. Therefore, an important question is how the melt becomes concentrated and how it is transported upward through the ductile portion of the tectonic plate.

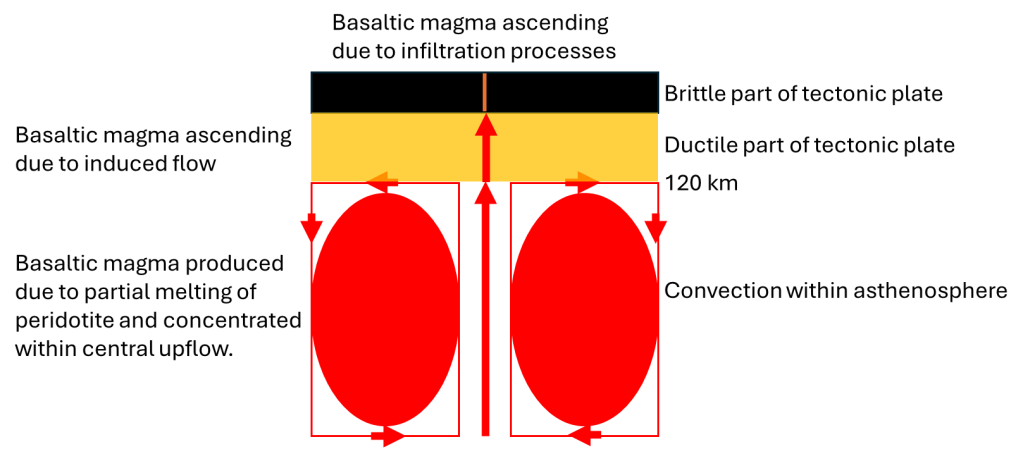
Partial melting of peridotite and the subsequent flow of basalt towards the surface

This schematic proposes that partial melting occurs in regions where pressure is reduced due to tectonic movements above. In addition, the interaction of adjacent convection rolls should combine their thermal influence with symmetric heat radiation, creating localized zones where conditions are favorable for partial melting.

The upward transport of melt through the ductile lithosphere must be assisted by some focusing mechanism, allowing it to move in narrow, directed pathways. Evidence for such pathways is found in the sheeted dike complexes within ophiolites, which could represent the uppermost expressions of these ascending melt channels.

One possible physical analogy is the Munroe effect, in which energy is focused into a narrow jet capable of penetrating solid material. In this context, a comparable mechanism might involve the concentration of thermal energy or stress along specific lines or zones, enabling sustained, directed upward flow through the ductile material. The symmetrical flow lines do then have to provide an appropriate “standoff”, a key concept regarding the physical preconditons of Munroe effect. Some might say that explosion on one hand and a steady process on the other hand are not comparable, but considering that the process is the same, even though one is short term, the other long term, the results will be similar.

Beneath oceanic plates, where the lithosphere is approximately 100 km thick, such focused flow could allow basaltic melt to traverse the ductile region. Upon reaching the brittle upper lithosphere, the melt would then exploit fractures and fissures, continuing its ascent.

Finally, as pressure decreases, volatiles exsolve from the magma, causing rapid expansion and increased buoyancy, which further drives the magma toward the surface or the seafloor.