Blog

Uncategorized

Kamchatka shows the curvature of mantle convection rolls – as the subduction counterpart of the Reykjanes Ridge!

Geology of calculations! The line of volcanoes in Kamtchatka follows the same formula as the volcanic zones in Iceland! It is exactly parallel to the Reykjanes Ridge.

The topography of Kamchatka has a very decisive linear form, and of course the volcanism there is well known. The reason for the volcanic activity is in a way opposite to that in Iceland, so it is interesting that the same formula can be applied to get exactly the correct direction following the chain of mountains, the division between mountains and lowlands etc. Here, it is shown how the curvature along the peninsula fits to the swaying form of the convection rolls underneath.

Kamchatka Peninsula - 01

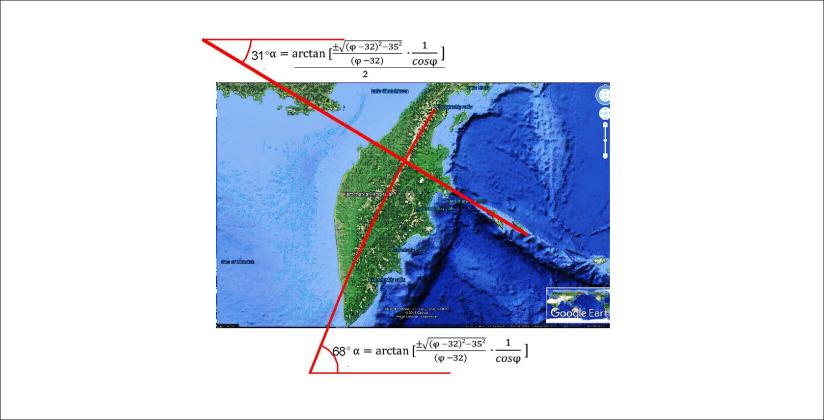
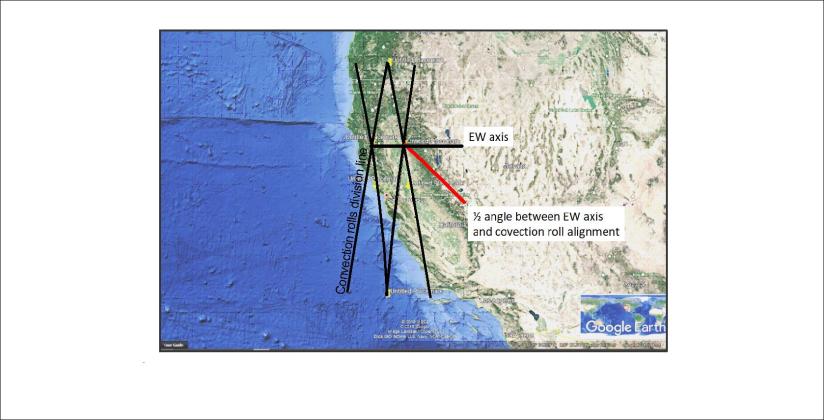
The inserted lines are calculated according to φ = 57° for hemispheric convection cells. The result is N28.6°E, shown with the slightly curved line for the drawing, which fits perfectly to the peninsula. The adjacent Alpha Fracture Zone is perpendicular to the Kuril-Kamchatka Trench and thereby to the tectonic framework and topographical trend of the peninsula. The angle is close to being half the calculated value for the latitude, as shown by a line extending from the continent out to the trench, oriented N58.2°W. The half angle value is added because it repeatedly found under similar circumstances, for Hekla, California, Hawaii, etc.


Uncategorized

The topography and tectonic drift of Hawaii calculated

The location and drift direction of Hawaii can be calculated! It is exactly the same calculation as previously made here for Yellowstone and California.

The formula is:

alignment of convection rolls = arc tan {[(35.342 – (ϕ – 32)2) 0.5  / (ϕ – 32)](1/cos ϕ)}

where ϕ is the latitude. Hawaii is on  19° 23.300’N.

The convection rolls are aligned close to N30°E and N30°W.

Hawaii - 05

The result for topography and tectonic drift is half of that angle:

α = (arc tan {[(35.342 – (ϕ – 32)2) 0.5  / (ϕ – 32)](1/cos ϕ)})/2

Hawaii - 03

This immediately reveals the main directions of the topography, sea bottom features, and of course the tectonic drift.

It is therefore nothing strange about the location of Hawaii. The location can be compared with the convection cells model of the mantle and understood accordingly.

The location can be compared with Iceland’s position within the convection rolls grid of the Earth, as has been done here in a previous post.

The framework around the San Andreas Fault

The tectonic alignment of Yellowstone calculated in the same way as for volcanoes in Iceland


Uncategorized

The framework around the San Andreas Fault

The Convection Cell Model can help us to understand our surroundings better. Let us have a look at California on a GIS map base.

San Fransisco - 02

The main fault is located within a polygon close to the main division line of lower layer convection cells under the Rocky Mountains.

San Fransisco - 05

The polygon is here shown on a Google map. The symmetry causes an EW tectonic axis to form within the ductile part of the tectonic plate.

The main convection roll and the EW-axis compete for ruling the tectonic alignment, resulting in a ‘draw’ due to the balanced ductility level presumed to prevail below the brittle crust. The main topographic alignment becomes half the angle between them, shown with the red line.

That red line, forming the ‘1/2 angle’ compared with the EW axis is here called α:

α = (arc tan {[(35.342 – (ϕ – 32)2) 0.5  / (ϕ – 32)](1/cos ϕ)})/2

where ϕ=39, so α=40.5°

The deviation from north at that latitude then becomes 90-40.5=49.5 or N49° 30’W.

With this knowledge at hand, analyzes of tension building up in the area becomes easier.

Uncategorized

Iceland compared with the Antarctic Peninsula

We are so lucky that we have land in the southern hemisphere at the same latitude as Iceland. It is known as the Antarctic Peninsula. We can compare the two areas quickly:

Iceland and Antartic Peninsula compared

By adding the outlines of the Antarctic Peninsula over Iceland according to similar positions according to the convection rolls, the coast of the peninsula follows the same trend as the main division line of the Atlantic Ocean as it can be traced over Iceland.

It looks like this on the map base of Náttúrufræðistofnun and Orkustofnun:

Iceland division line

The accuracy is quite striking, but again we have to have in mind that the same kind of forces underneath shape the surface. You do not have to look twice:

Iceland division line with Antarctica division line

The comparison is not only made according to latitudes, but general layout of Antarctica compared with the Arctic Ocean. For curious people the drawing on the Google map is shown here:

Skautin borin saman - 01

What was that? Now we can start speculating!


Uncategorized

Faxi – the surprise waterfall of the Golden Circle of Southern Iceland

Faxi
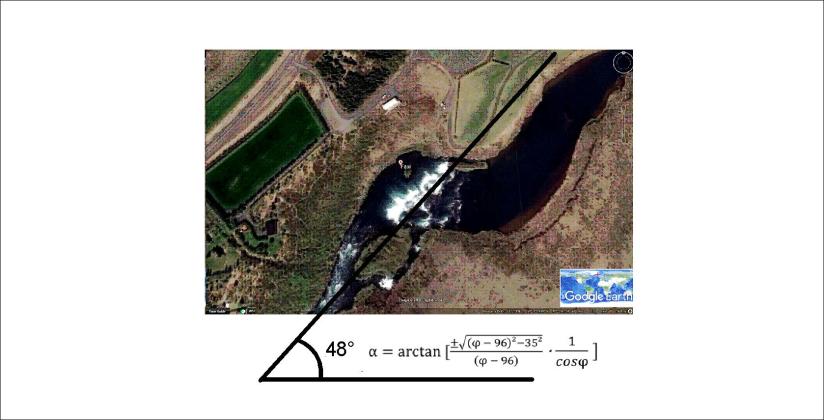
Faxi is not far from Gullfoss and Geysir and has been seen by many on the so called Golden Circle Tour. Again, the alignment of the waterfall is a curiosity. The river Tungufljót makes a turn and forms a waterfall over the cliffs almost in the opposite direction of the river. This feature can be calculated, as the cliffs follow the orientation of convection rolls. This is best shown with a Google map and the relevant drawing and formula:

Faxi - 02

The direction is N42°E, as the drawing shows E48°N according to the direct result of calculation (with ϕ=64.22).

This could be a coincidence, but many identical results makes it less likely. Just compare this with a former post about Dettifoss (with ϕ=65.80):

Dettifoss og Faxi - 01

The same formula applied at these different latitudes marks the alignment of both waterfalls!