The Convection Cell Model can help us to understand our surroundings better. Let us have a look at California on a GIS map base.

The main fault is located within a polygon close to the main division line of lower layer convection cells under the Rocky Mountains.
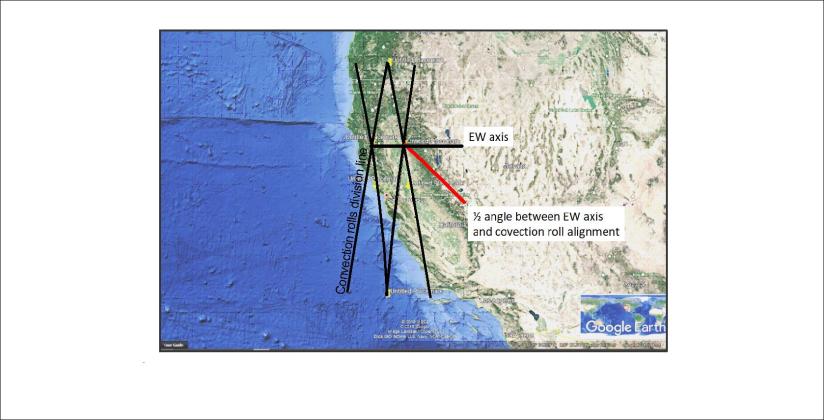
The polygon is here shown on a Google map. The symmetry causes an EW tectonic axis to form within the ductile part of the tectonic plate.
The main convection roll and the EW-axis compete for ruling the tectonic alignment, resulting in a ‘draw’ due to the balanced ductility level presumed to prevail below the brittle crust. The main topographic alignment becomes half the angle between them, shown with the red line.
That red line, forming the ‘1/2 angle’ compared with the EW axis is here called α:
α = (arc tan {[(35.342 – (ϕ – 32)2) 0.5 / (ϕ – 32)](1/cos ϕ)})/2
where ϕ=39, so α=40.5°
The deviation from north at that latitude then becomes 90-40.5=49.5 or N49° 30’W.
With this knowledge at hand, analyzes of tension building up in the area becomes easier.

1 thought on “The framework around the San Andreas Fault”