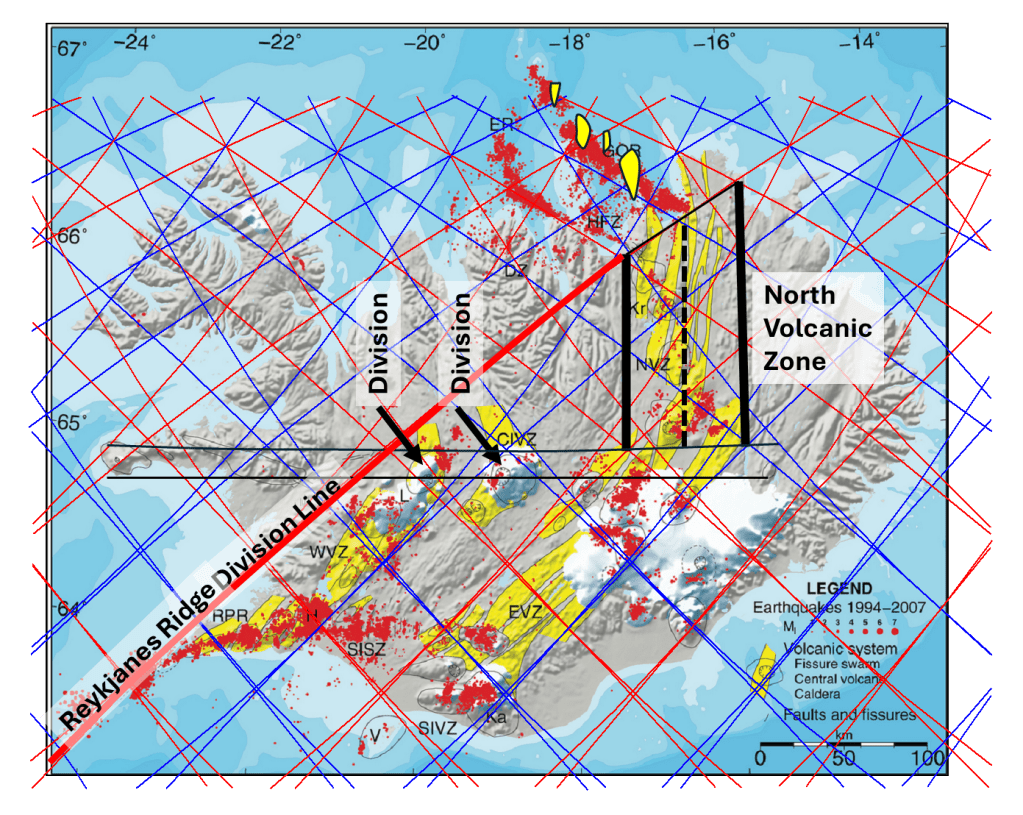
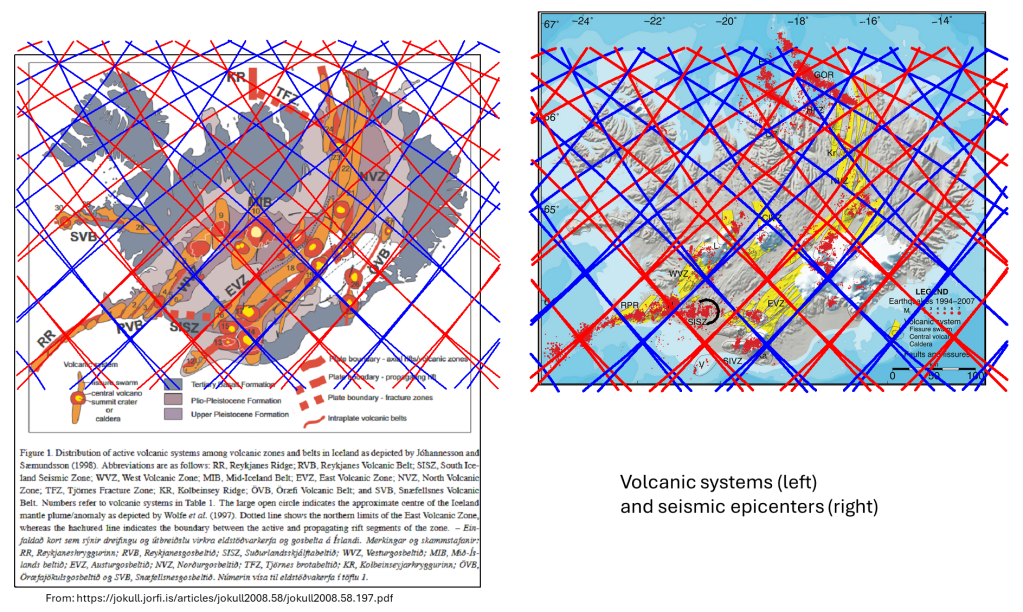
The Mid-Iceland Belt (MIB), also referred to as the Central Iceland Volcanic Zone, forms the volcanic connection between the West Volcanic Zone (WVZ) and the East Volcanic Zone (EVZ). Although the precise outlines of individual volcanic systems—particularly those associated with Hofsjökull and Kerlingarfjöll—vary somewhat between published maps, the overall geometry of the belt is consistent.
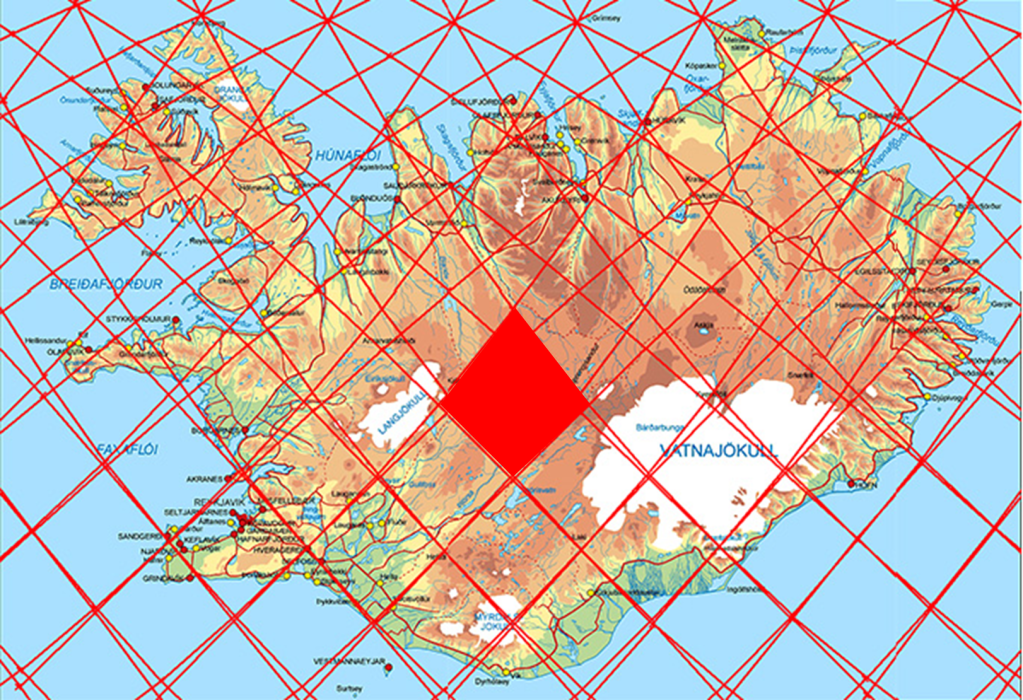
Within the Mantle Convection Rolls Model, the MIB occupies a central polygon bounded by division lines separating adjacent convection rolls. In addition, many tectonic maps depict a plate-boundary trace aligned approximately east–west through the MIB, reinforcing its interpretation as a zone of plate-scale interaction rather than a simple rift segment.
Why the MIB differs fundamentally from WVZ and EVZ
The adjacent volcanic zones, WVZ and EVZ, can be interpreted as rifting zones located above convection rolls whose flow direction opposes the absolute motion of the overlying plate. In those zones, mantle flow and plate motion combine to promote sustained extension and focused rift volcanism.
The MIB does not fit this configuration. Located between the opposing roll-controlled rift systems, it occupies a region where this rifting mechanism does not apply directly. Its existence therefore cannot be explained as a primary spreading axis driven by roll-opposed plate motion. Instead, the MIB must be understood as a structural connection zone accommodating the transfer of deformation between the WVZ and EVZ.
Analogy with the South Iceland Seismic Zone
It has often been noted that the MIB performs a role analogous to that of the South Iceland Seismic Zone (SISZ). The SISZ is characterized by tectonically driven strike-slip and oblique faulting, accommodating lateral plate motion rather than sustained rift volcanism. The MIB is broadly parallel to the SISZ and occupies a comparable central position within its convection-roll polygon.
Between the polygons associated with the SISZ and the MIB lies an intermediate polygon, here referred to as the Hreppar Polygon (HP). Some interpretations treat the SISZ and HP—together with adjacent areas, often including the western margin identified as the Þingvellir rift—as a distinct tectonic microplate. In this framework, the northern boundary of that microplate coincides with the transition across the MIB.
Internal complexity of the MIB polygon
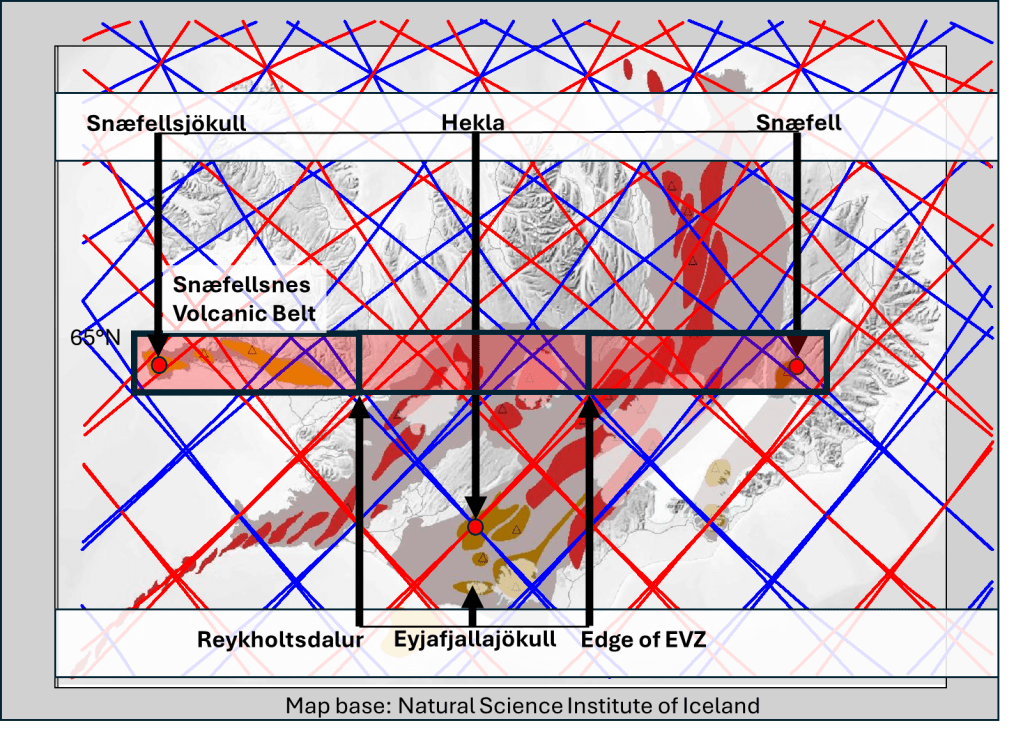
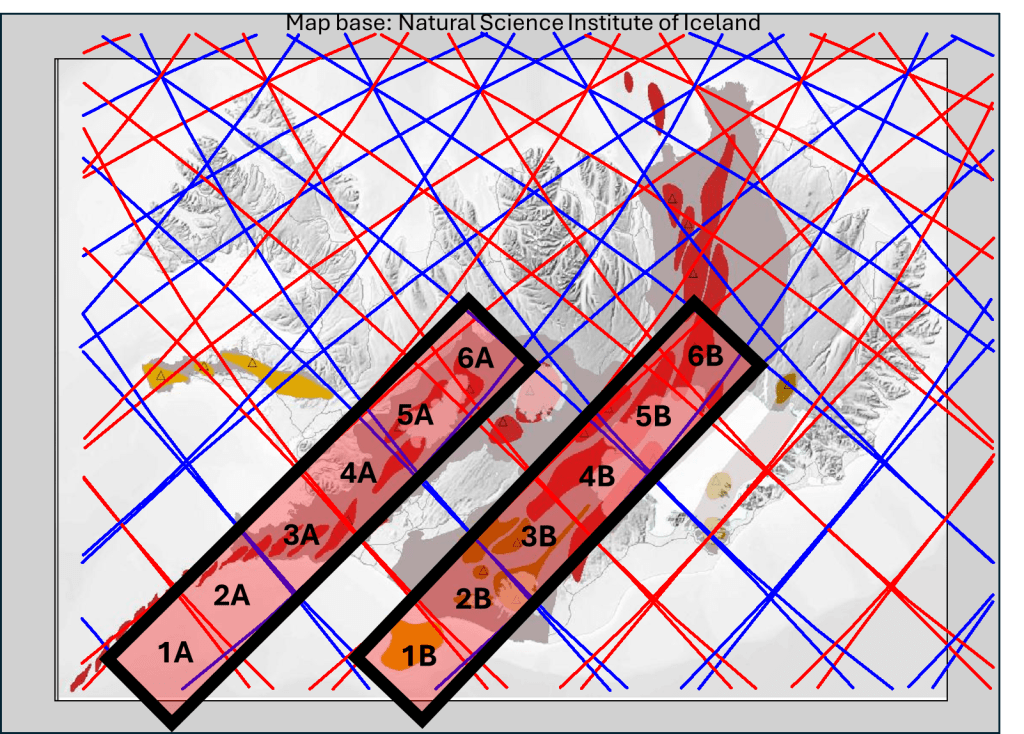
The MIB polygon itself displays a dual structural character. In its southern half, the bounding division lines of the convection rolls converge closely, producing a relatively unified structural pattern. Farther north, these division lines diverge, and an additional micro-polygon appears in the north corner. In this area, fissure swarms extending from the Hofsjökull central volcano exhibit an orientation that differs from that of the southern MIB, indicating localized reorganization of stress.
Comparison with the Tjörnes Fracture Zone
A useful comparison can be made with the Tjörnes Fracture Zone. Within the TFZ, the Húsavík–Flatey Fault accommodates almost exclusively horizontal dextral motion and has done so continuously for millions of years, producing a cumulative offset on the order of 60 km on each side. In contrast, the Grímsey Oblique Rift exhibits both seismic and volcanic activity. Although it is broadly parallel to the Húsavík Fault, it serves a different function: accommodating the combined tectonic and magmatic processes required to link the North Volcanic Zone with the Kolbeinsey Ridge.
In an analogous manner, the SISZ and the MIB together form a paired system: one zone primarily accommodating horizontal tectonic motion, the other incorporating significant volcanic processes.
Latitudinal variation in polygon patterns
The geometric arrangement of convection-roll polygons differs markedly between southern and northern Iceland. In the south, large and relatively regular polygons give rise to east–west-oriented structures, with one zone dominated by horizontal shear (the SISZ) and another incorporating volcanism (the MIB). In the north, the polygon pattern instead permits the development of a single, long-lived, continuous transform fault, represented by the Húsavík–Flatey Fault. Within the adjacent row of polygons, the Grímsey Oblique Rift fulfills the volcanic role associated with plate-boundary connection.
Closing synthesis
Taken together, these observations suggest that the Mid-Iceland Belt is neither a simple rift nor a conventional transform zone. Instead, it represents a mantle-controlled connection zone, complementary to the South Iceland Seismic Zone in the south. The pair of MIB and SISZ is analogous in function to the Grímsey Oblique Rift and Húsavík Fault in the north. The geometry of the MIB, internal complexity, and relationship to adjacent volcanic zones are best understood in terms of the spatial organization of mantle convection rolls rather than solely through plate-boundary kinematics.