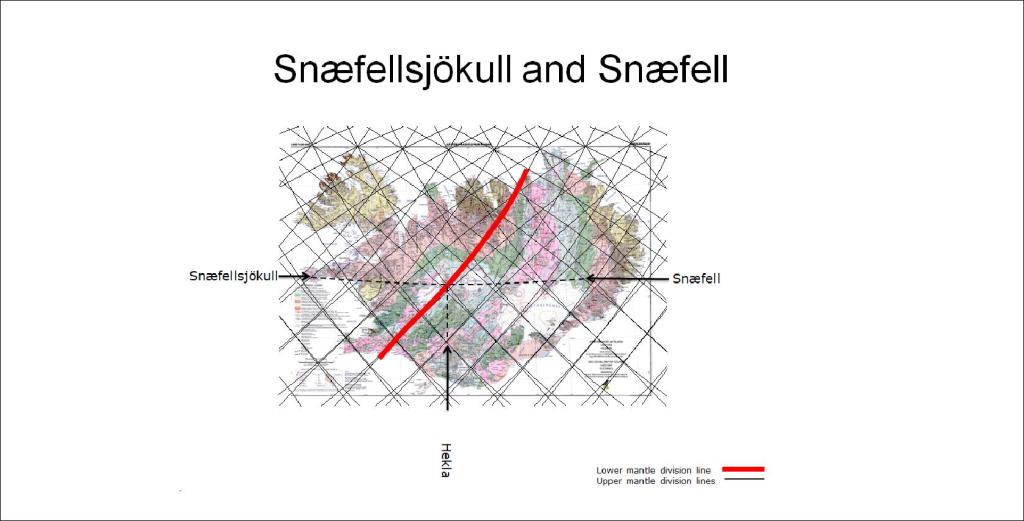
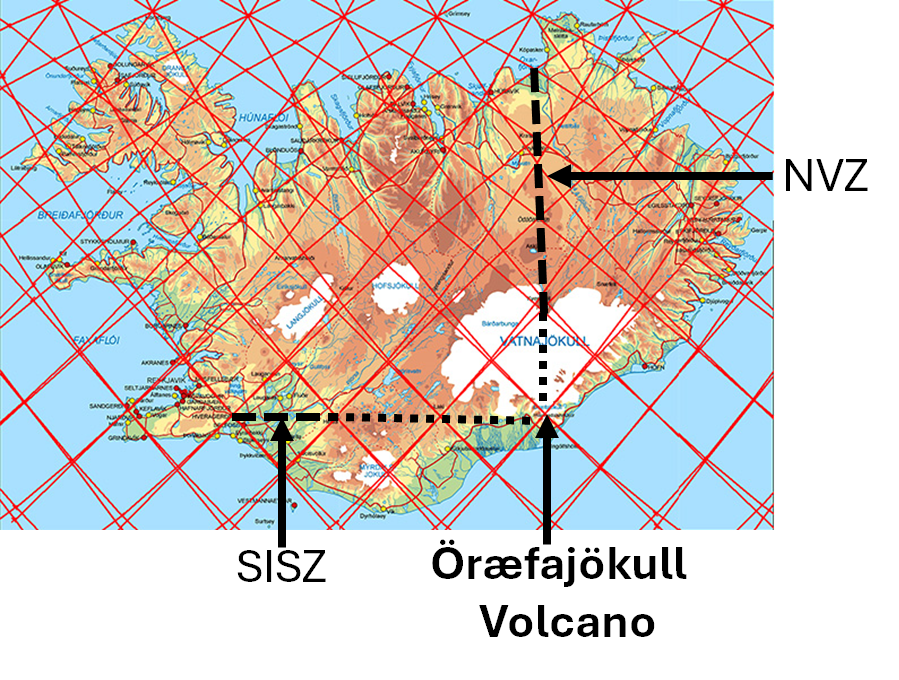
The tenth eruption on the Reykjanes Peninsula started suddenly on the Sundhnúkagígar fissure. All those eruptions are thought to be connected and considered to be one volcanic event, based on rather constant flow of magma from the interior. The model used here adds an explanation of the geophysical settings of the deep roots of the volcanic site. Two convection rolls division lines coincide under the point where the magma ascends. The lines cross the outer limits of the seismic zone at this location, providing a weakness in the crust.

Convection rolls model and site of ascending magma at Reykjanes Peninsula.
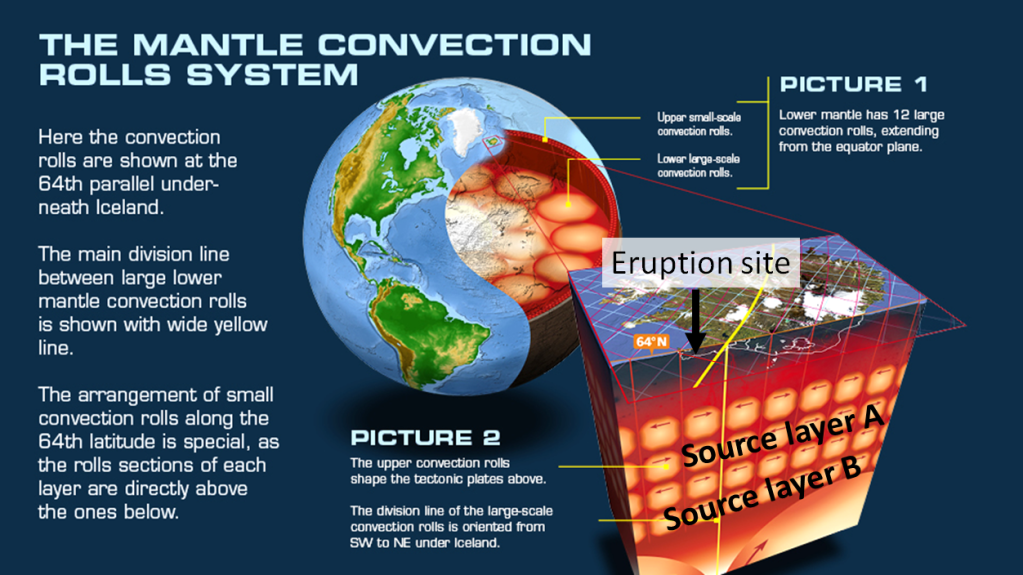
To understand how the system works according to the model, this drawning can be studied. The two layeres, with division lines between convection rolls found under the point of ascending magma, are marked here as source layer A and source layer B. Layer A is found at the depth of about 260 km, and layer B at 530 km depth (530-670 km). This means that magma of different types should be found, both from layer A and B. Besides that, the hot magma from below does partially melt the ductile part of the tectonic plate (commonly referred to as upper mantle found below the brittle crust).
The petrology of the lava should therefore be compared with these modelled preconditions of the eruptions. The three eruptions on Fagradalsfjall volcano and the seven eruptions on the Sundhnúkar fissure are originated from the same source, according to the findings in the article: The Fagradalsfjall and Sundhnúkur Fires of 2021–2024: A single magma reservoir under the Reykjanes Peninsula, Iceland? ( https://www.researchgate.net/publication/381756298_The_Fagradalsfjall_and_Sundhnukur_Fires_of_2021-2024_A_single_magma_reservoir_under_the_Reykjanes_Peninsula_Iceland
The authors of the article (Valentin R. Troll. Frances M. Deegan, Thor Thordarson, Ari Tryggvason, Lukáš Krmíček, William M. Moreland, Björn Lund, Ilya N. Bindeman,
Ármann Höskuldsson and James M. D. Day), come to this conclusion: “Whole rock and mineral geochemical data show that the
2023 SVL eruption produced lava compositions that, for the most
part, continue the trends established by the lavas of the late 2021 to
2023 Fagradalsfjall Fires (Figures 4 and 5). A first-order observation
is therefore that all of the recent FVL and SVL magmas are derived
from a similar magma source (excluding perhaps the early parts of
the 2021 Geldingadalir eruption), or a similar combination of sources,
which are different to the source(s) of previous magmas erupted on
the RP…”
Considering that, according to the model of convection rolls, it is quite likely that the uppermost division lines, oriented SW-NE, often provide magma from the mantle. This time it is probably not the case, as it seems likely that the source is from those deeper layers, because the relevant division lines are found exactly under the magma source location, which might explain different composition of the lava samples considered in the said article.