The Convection Rolls Model has been used to explain a myriad of geological features. The starting point is easy to derive, because the layers of Earth have a regular pattern, and Rayleigh-Bénard type of convection rolls fit precisely into it.
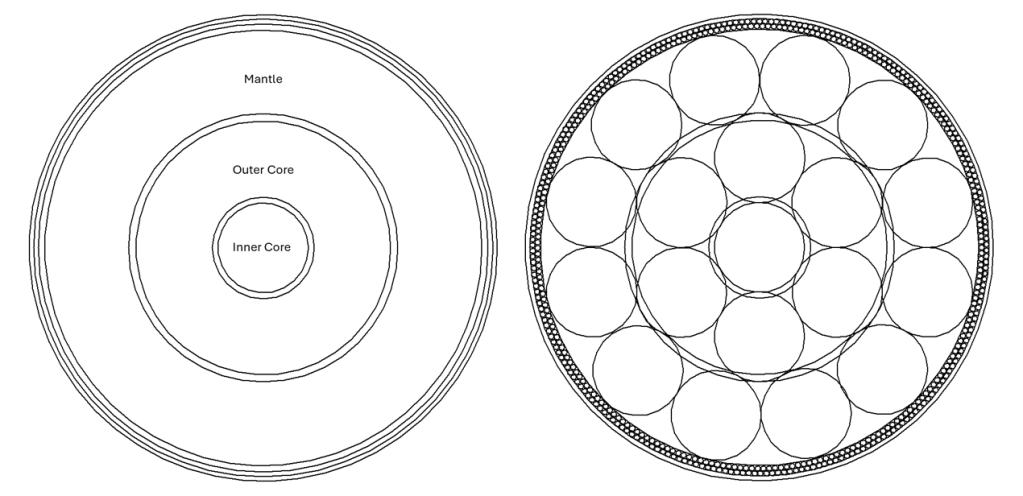
Layers of Earth and Rayleigh-Bénard convection rolls inserted.
The convection rolls are affected by the rotation of the Earth, and the same proportions prevail farther north and south within the rotational plane. The height and width of the mantle convection rolls therefore adhere to the physics of Rayleigh-Bénard convection all over the globe.
Therefore, it was possible to derive the comprehensive or global convection rolls model, starting from the obvious match within the equatorial plane.
The match shown above is mathematical, to show that the intersection zones are really intersections between main layers. At equator, the convection rolls tend to be arranged directly above each other.
This drawing shows how the convection rolls are arranged directly above each other. It also shows secondary convection rolls within the lower mantle. The Lehmann layer of the core is omitted here. The system can then be traced northwards and southwards, and the global system derived, which is described here.
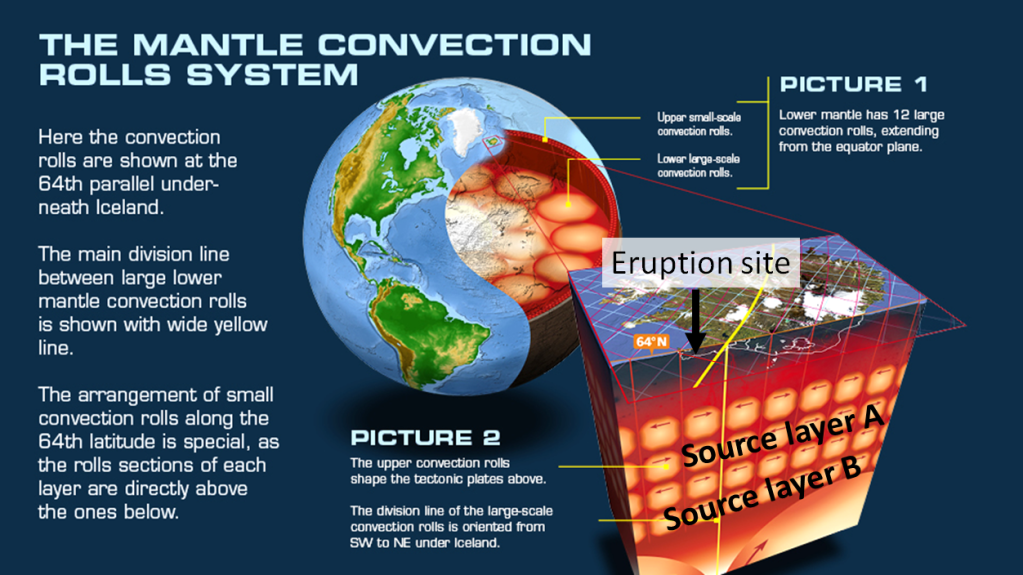
The tenth eruption on the Reykjanes Peninsula started suddenly on the Sundhnúkagígar fissure. All those eruptions are thought to be connected and considered to be one volcanic event, based on rather constant flow of magma from the interior. The model used here adds an explanation of the geophysical settings of the deep roots of the volcanic site. Two convection rolls division lines coincide under the point where the magma ascends. The lines cross the outer limits of the seismic zone at this location, providing a weakness in the crust.
Convection rolls model and site of ascending magma at Reykjanes Peninsula.
To understand how the system works according to the model, this drawning can be studied. The two layeres, with division lines between convection rolls found under the point of ascending magma, are marked here as source layer A and source layer B. Layer A is found at the depth of about 260 km, and layer B at 530 km depth (530-670 km). This means that magma of different types should be found, both from layer A and B. Besides that, the hot magma from below does partially melt the ductile part of the tectonic plate (commonly referred to as upper mantle found below the brittle crust).
The authors of the article (Valentin R. Troll. Frances M. Deegan, Thor Thordarson, Ari Tryggvason, Lukáš Krmíček, William M. Moreland, Björn Lund, Ilya N. Bindeman, Ármann Höskuldsson and James M. D. Day), come to this conclusion: “Whole rock and mineral geochemical data show that the 2023 SVL eruption produced lava compositions that, for the most part, continue the trends established by the lavas of the late 2021 to 2023 Fagradalsfjall Fires (Figures 4 and 5). A first-order observation is therefore that all of the recent FVL and SVL magmas are derived from a similar magma source (excluding perhaps the early parts of the 2021 Geldingadalir eruption), or a similar combination of sources, which are different to the source(s) of previous magmas erupted on the RP…”
Considering that, according to the model of convection rolls, it is quite likely that the uppermost division lines, oriented SW-NE, often provide magma from the mantle. This time it is probably not the case, as it seems likely that the source is from those deeper layers, because the relevant division lines are found exactly under the magma source location, which might explain different composition of the lava samples considered in the said article.
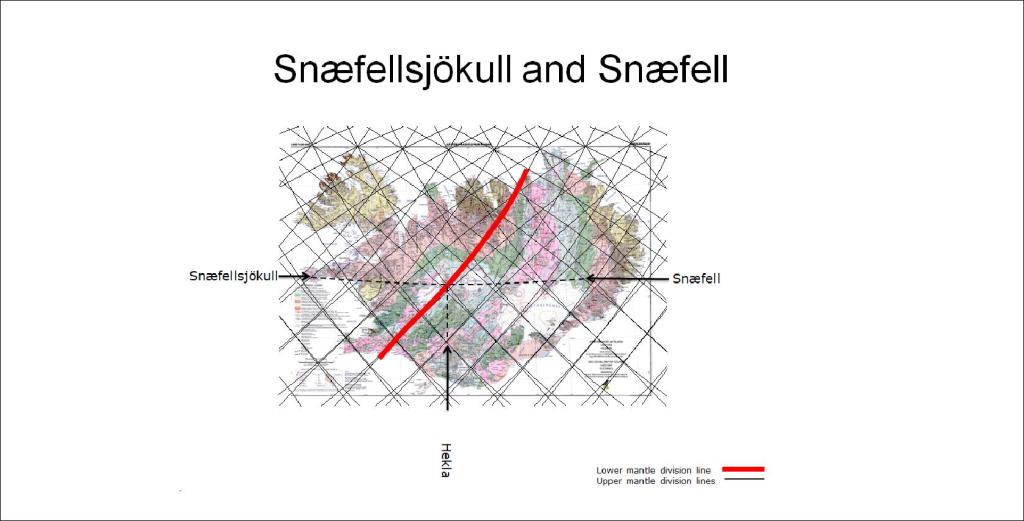
The two outposts of Icelandic volcanoes are both stratovolcanoes. They are outside the main volcanic zones, and do not fit with the most simplified version of Icelandic geology. One is too far to the west, the other too far to the east to match well with our most basic ideas about how Iceland is divided into its North American part and Eurasian part. The convection rolls model considered on this webpage is of course different, and according to the pattern emerging from the division lines between convection rolls, the positions become understandable. If there were no such reasons, such as convection rolls, the coincidence that those two mountains are exactly on the same latitude could not be explained. Of course it is easy just to ignore things like that, but these two volcanoes are both found on division lines between convection rolls, in a mirrored way.
It should also be mentioned that the distance from those two volcanoes to the main division line of the lower mantle, is exactly the same, when compared with the N-S axis of Hekla volcano. That means, of course, that the two Snæffells (Snæfellsjökull and Snæfell) are equidistant from Hekla. Such a coincidence can of course also be ignored, but according to this system of convection rolls, it is explainable, because Hekla does form on important crossings within the convection rolls division lines pattern. Different layers all have division lines under Hekla, four different convecting layers! The location of Hekla is therefore no coincidence, and the uppermost layer of mantle convection is upwelling underneath Hekla, making the location even more understandable. All over the world, countless similar patterns can be found, all in harmony with the convection rolls.
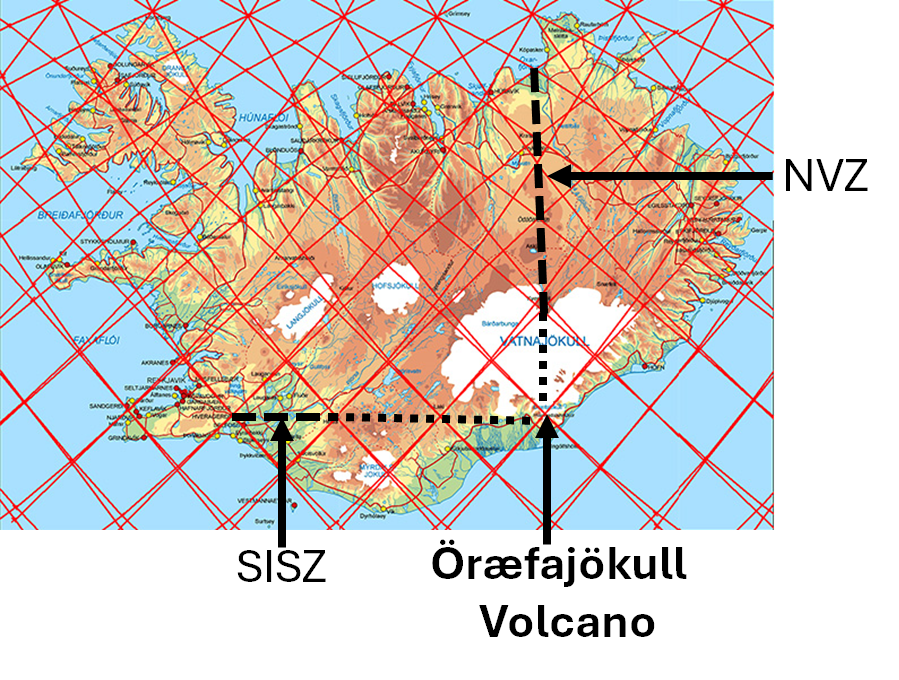
The highest volcano of Iceland is far east of the main volcanic zones. The position is easy to understand when looking at the convection rolls system map. The top of the mountain is above the crossings of the four sets of upper convection rolls found underneath it. Besides that, Öræfajökull is found as a continuation to the south of the North Volcanic Zone (NVZ), and on the same line as the South Iceland Seismic Zone (SISZ) on the 64th parallel.
All other volcanic sites in Iceland can be analysed in a similar way. The Convection Rolls Model is a very effective tool which can be used to better understand the framework of volcanic, seismic and geothermal areas everywhere in the world.
In Iceland, many people think that a mantle plume is responsible for volcanic activity. The plume is thought to be centered around the western part of Vatnajökull. All the same Gilliam R. Foulger came to the conclusion that a plume, of the kind imaged, can not exist. https://www.mantleplumes.org/WebDocuments/P%5E2Rev_Harangi.pdf
In fact, Foulger does find a proof that this kind of plume does not exist. The relevant data shows that no continuous hot mass is ascending under Iceland. Therefore we should stop imaging this plume and continue the search for the inner structure of Earth with measurements and calculations according to the physical properties of the mantle.
Convection does, on the other hand, fit all available data. Experiments show that mantle material forms convection rolls under those circumstances expected to prevail within the Earth. Testing it, by making a model with convection rolls filling the measured layers, shows remarkable results. Features on Earth, both divergent and convergent, fit to the convection rolls underneath.
Now, when this has been solved, it is very easy to proceed with research programs, further improving our understanding of the inner structure of the Earth. First, we have to admit that the former idea about mantle plumes is wrong. A model of a regular system of convection rolls is what brings us farther ahead. Luckily, we have the scientific method to assist us with our work. By having a foundation of physics, measurements, mapping, calculations and logical thinking, besides being able to communicate freely, these steps forwards can be made.