Blog

Uncategorized

How Basaltic Magma Ascends within Subduction Zones

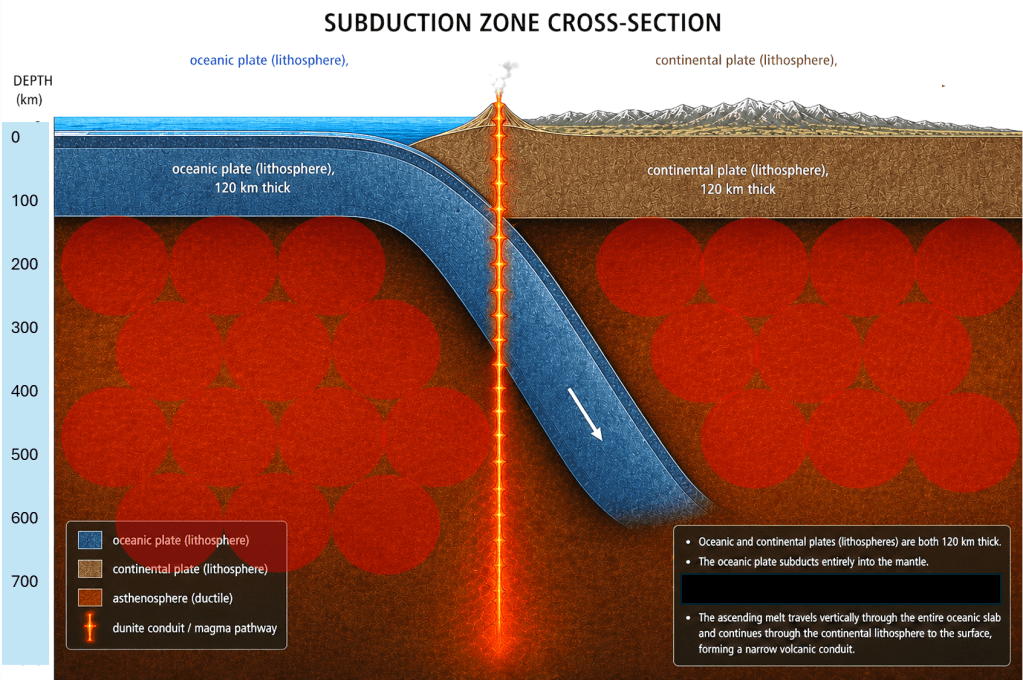
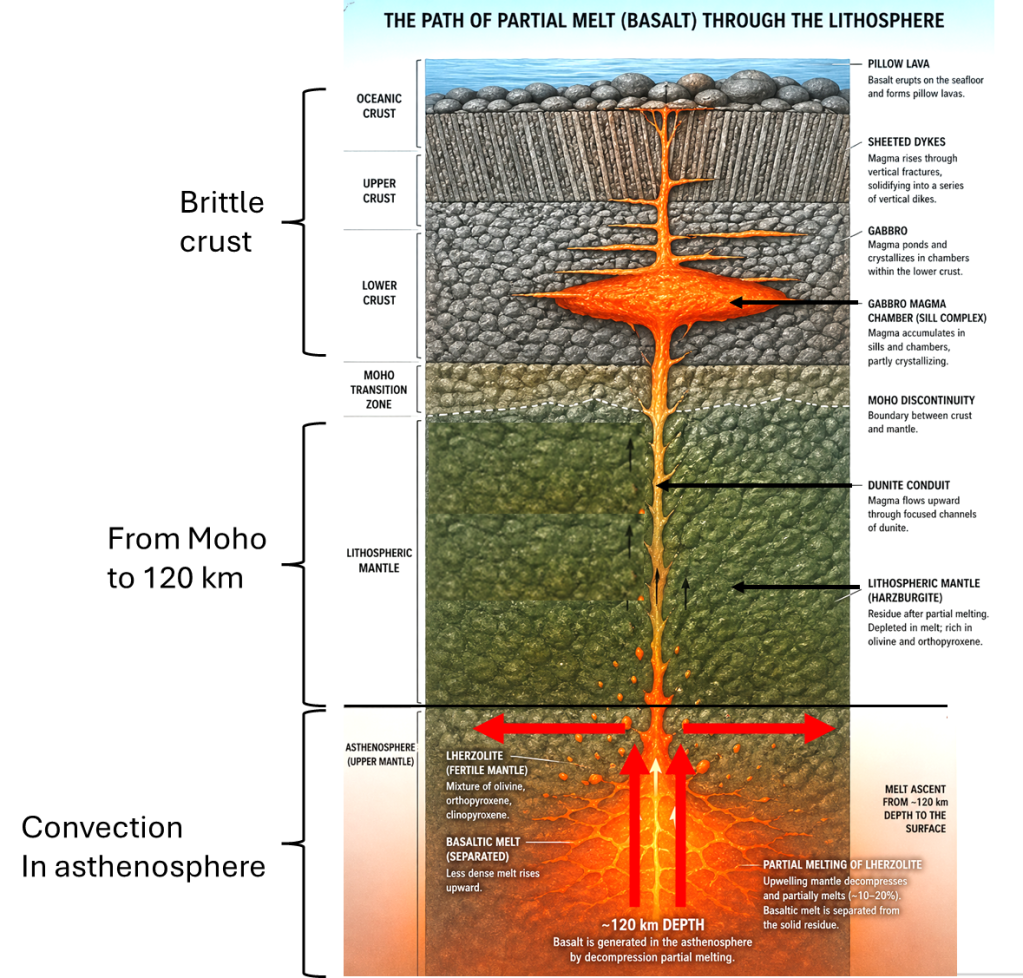
I did discuss how magma must ascend from below the descending slab. If not, there would not be enough mantle material available for partial melting, not enough heat because of the cooling effect of the slab, etc. Simplifying the picture, emphasizing on the ascending magma only, the idea can be drawn AI-style:

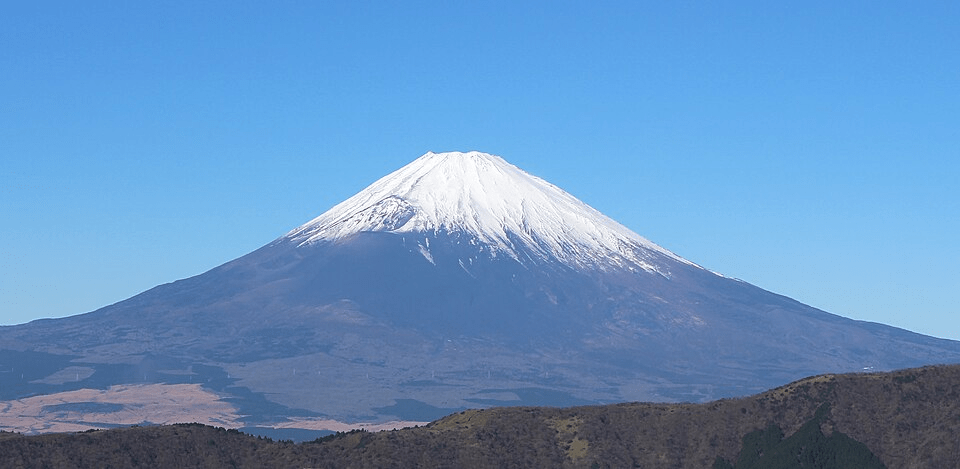
In this way the production of basalt for Mt. Fuji, for instance, can be explained.

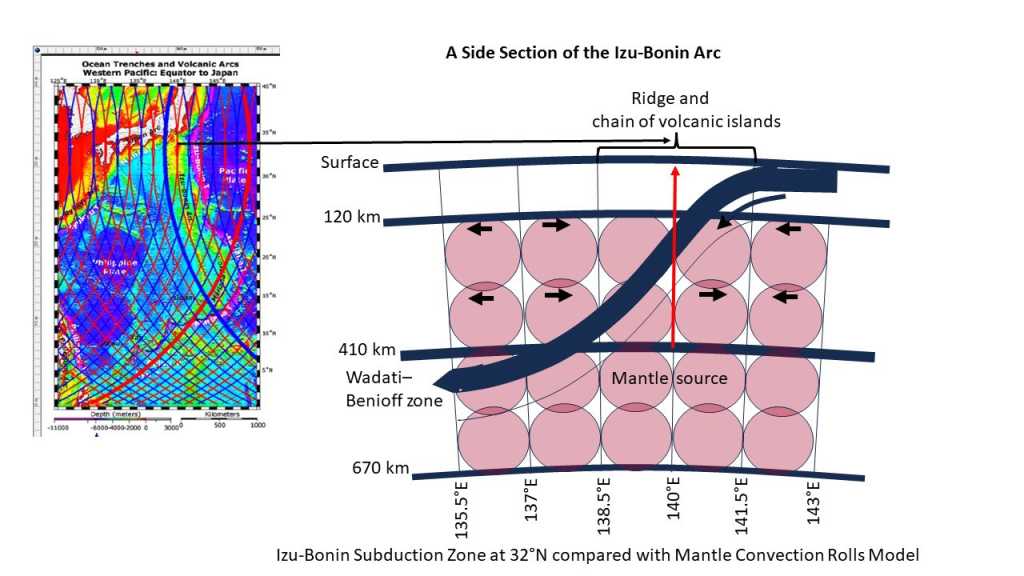
This can be tested by comparing sections of subduction zones with the model.

Fuji

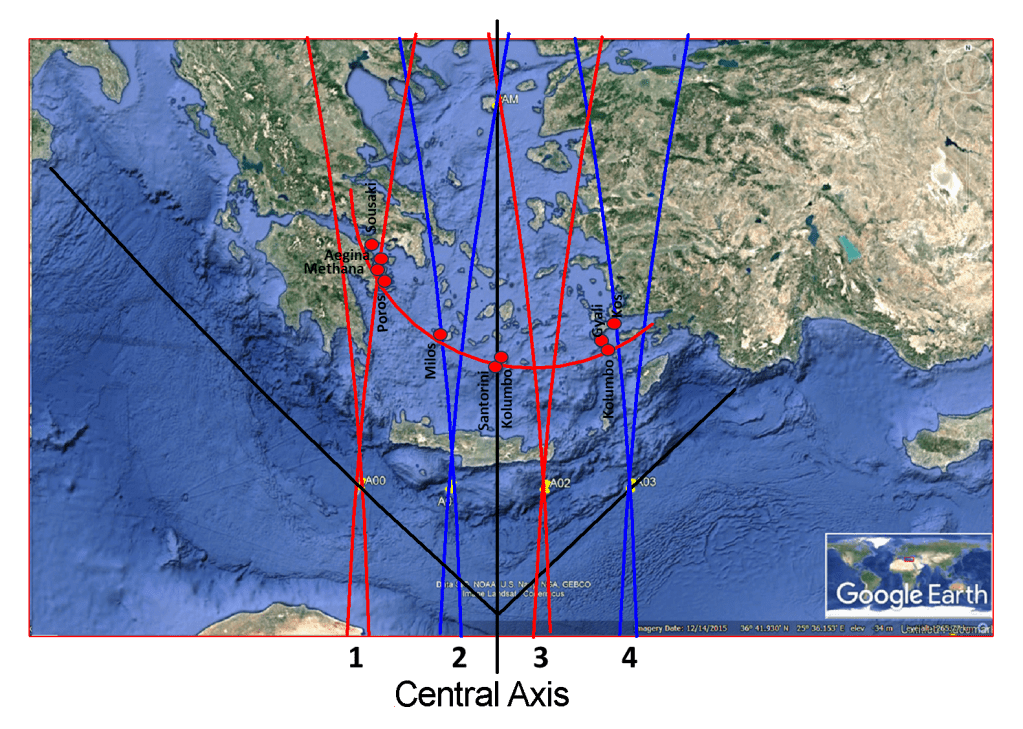
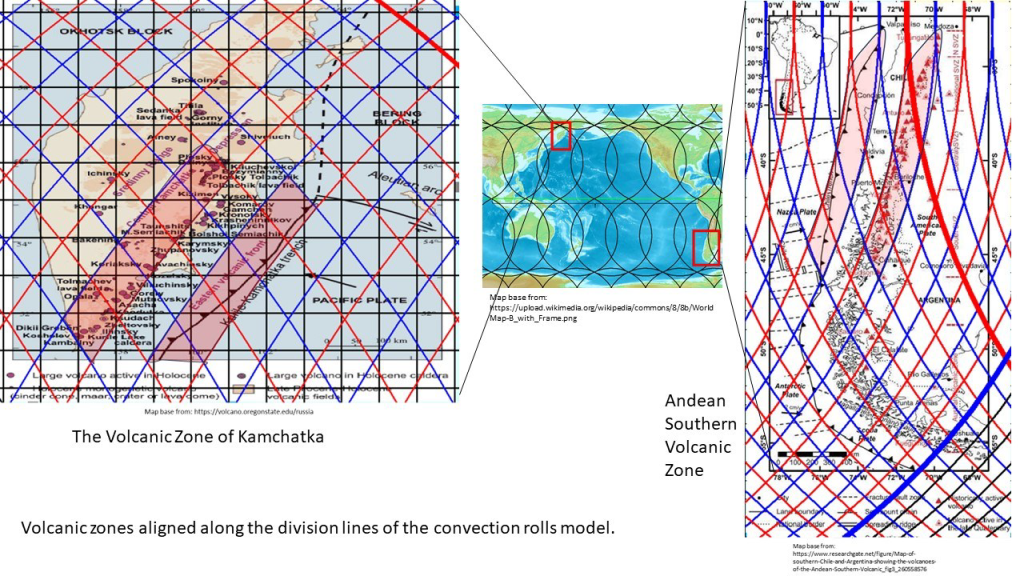
There are many examples of how the model shows consistency with actual circumstances, position, alignment, and length. Trenches and volcanic zones also tend to coincide with convection rolls, the trench following the scope of a roll, then one roll is found in between the trench and the volcanic roll, and finally the bulk of volcanic activity is found in context with one roll. These three rolls are parallel to each other. The volcanic activity also tends to terminate at the border of a polygon. Here, two examples of this type of subduction are provided, from different corners of the Pacific Ocean:

The geology of these areas should then be analyzed for each of those diamond-shaped areas marked on the maps.

Uncategorized

The Distribution of High-Temperature Geothermal Areas in Relation to Plate Boundaries and Mantle Convection in Iceland

There are two main rules governing the distribution of high-temperature geothermal areas:
(1) their location along the boundaries between tectonic plates, and
(2) their alignment with the boundaries of mantle convection rolls.

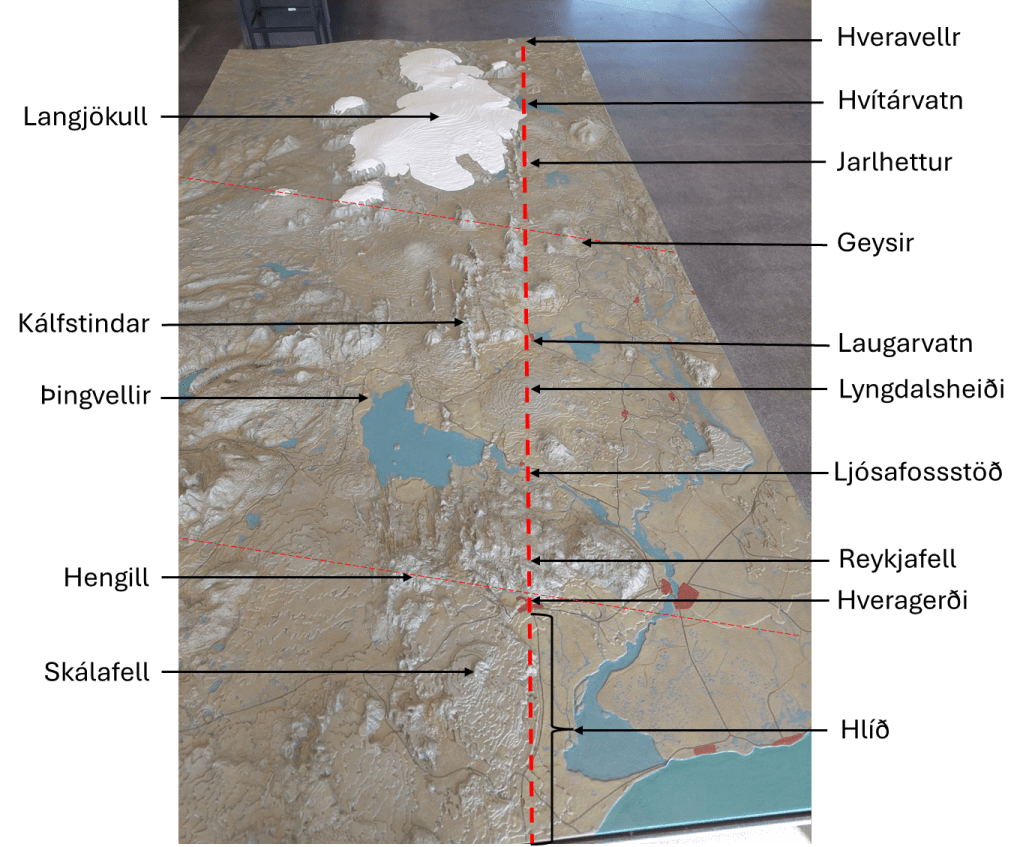
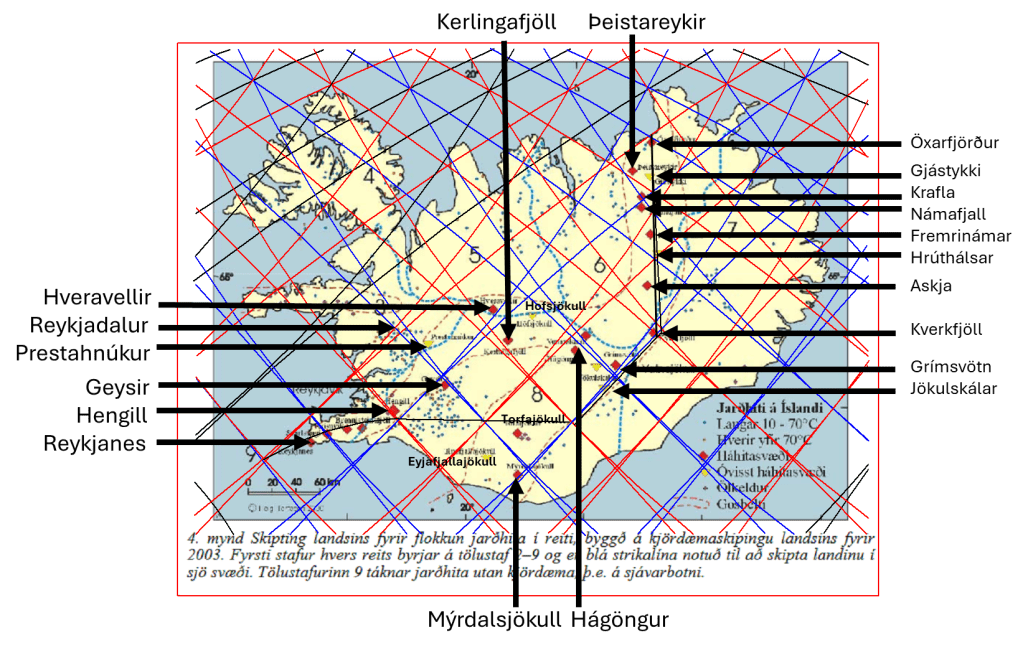
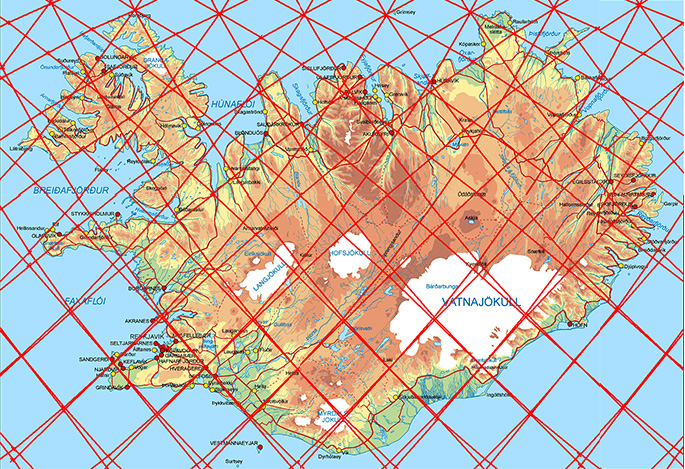
High temperature areas in Iceland pointed out.

Not all the high-tempereature areas are directly “pointed at” here, because the purpose is not to show a list, only that the location of those areas can be linked to an understandable process within the whole tectonic plate. Intrusions of magma were responsible for all those formations.

In practice, almost all high-temperature areas are located either directly on, or immediately adjacent to, these lines. The main exceptions are Eyjafjallajรถkull, which is known to be connected to its neighbouring system beneath Mรฝrdalsjรถkull, and Hofsjรถkull, where the presence of a high-temperature area is somewhat uncertain. Map base: https://vatnsidnadur.net/wp-content/uploads/2023/12/NI-03016.pdf

The Torfajรถkull area lies somewhat distant from the plate boundary, yet it is the largest and most powerful of all high-temperature systems in Iceland. However, the area is highly fractured, suggesting that its roots may extend toward the plate boundary at depth.

Taken together, all 24 areas appear to occur within a similar structural context. Not every area is pointed out with an arrow, but in this way the consistency becomes more obvious.

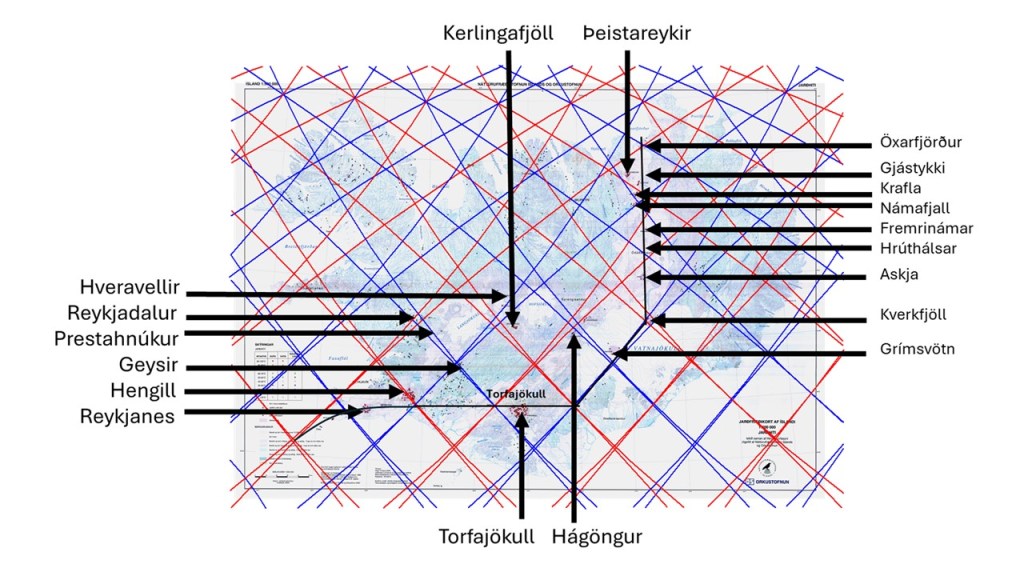
This map is more accurate, and the consistency becomes more obvious. On the other hand, the locations are less clearly marked. Comparing those two maps is therefore ideal.

The fact that two different factors are relevant here, division between tectonic plate and convection rolls division lines is of course intriguing. It must be kept in mind that the origin of these lines is to be traced 120 km below the surface. This AI drawing tells a story:

AI-version of the ascending path of magma – not to scale.

The remarkable aspect is how precisely the vertical flow from asthenospheric roots appears to be aligned along the boundaries of convection rolls. In contrast, along plate boundaries, according to this model, magma travels laterally before ascending at its final location. The divergent tectonic process creates pathways that allow magma to accumulate in these zones, leading to the formation of high-temperature geothermal areas.

List of Main High-Temperature Geothermal Areas in Iceland:


  1. Hveravellir
  2. Reykjadalur
  3. Prestahnรบkur
  4. Geysir
  5. Hengill
  6. Reykjanes
  7. Kerlingarfjรถll
  8. Mรฝrdalsjรถkull
  9. Hรกgรถngur
  10. Vonarskarรฐ
  11. รžeistareykir
  12. ร–xarfjรถrรฐur
  13. Gjรกstykki
  14. Krafla
  15. Nรกmafjall
  16. Fremrinรกmar
  17. Hrรบthรกlsar
  18. Askja
  19. Kverkfjรถll
  20. Grรญmsvรถtn
  21. Jรถkulskรกlar
  22. Hofsjรถkull
  23. Eyjafjallajรถkull
  24. Torfajรถkull
Uncategorized

What We Learn from Ophiolites

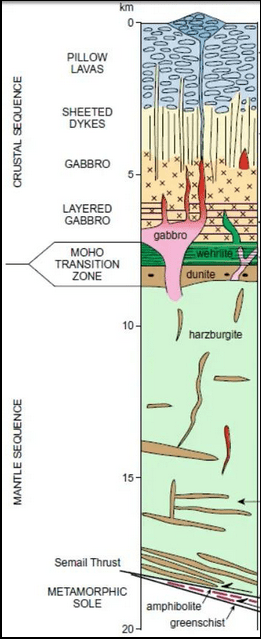
Ophiolites are slices of oceanic crust that have been uplifted and exposed, making it possible to examine a cross-section of a tectonic plate. This provides a valuable opportunity to study the different layers of the Earth. There are many ophiolites, the most famous probably being those found in Oman and Cyprus. These were emplaced onto continental crust through obduction and are in some cases tilted or rotated.

The uppermost ~5 kilometers of the brittle oceanic crust can thus be examined in cross-section. At the top lies a layer of pillow lavas, beneath which are sheeted dikes, followed by a gabbro layer extending down to the Moho discontinuity. In favorable cases, ophiolites also expose portions of the underlying mantle.

At the Moho, there is typically a transition zone composed mainly of two rock types: wehrlite just below the gabbro, followed by dunite. Beneath this lies the lithospheric mantle, which is composed mainly of harzburgite. This is a type of peridotite that remains after the original lherzolite of the asthenosphere has undergone partial melting to produce basalt.

Basalt originates from the asthenosphere at depths of around 120 km. The temperature of basalt at eruption at the Earthโ€™s surface is surprisingly close to the temperature at which it originally formed. In Iceland, basalt may represent up to about 20% partial melting of the original lherzolite.

One particularly important feature revealed by the exposure of mantle below the Moho is the presence of conduits through which partial melt (basaltic magma) has traveled. These conduits consist of dunite, composed almost entirely of olivine. They form vertical channels leading up toward the Moho. This indicates that partially molten material can flow upward relatively rapidly, entering the gabbroic section immediately above the Moho transition zone.

The gabbro zone is commonly divided into two parts, with the lower portion showing layered structures. Within this zone, basaltic magma can accumulate in sills and magma chambers, where it may partially crystallize before continuing its ascent. When conditions allow, the magma rises again, typically vertically, through the sheeted dike complex, forming successive dikes.

As frequently observed in Iceland, such processes can eventually lead to volcanic eruptions at the surface. On the ocean floor, these eruptions typically produce pillow lavas. The vertical continuity and rather fast flow of basalt up through the tectonic plate can explain how it maintains temperature (almost) found at the depth of 120 km at the surface. This AI picture expresses the process:

AI-version of the ascending path of magma – not to scale.

The vertical movement of partially melted material through the tectonic plates can partly explain why division lines in the asthenosphere can be detected at the surface. This process continues over long distances, forming dikes of considerable length. Even more importantly, this ongoing process creates divisions around which different parts, often described here as polygons, can adjust to the tectonic drift that constantly alters the positions of continents and oceanic crust. Another contributing factor is the local horizontal movement, combined with the global tectonic drift trend, which can lead to localized rifting or pressure at the surface.

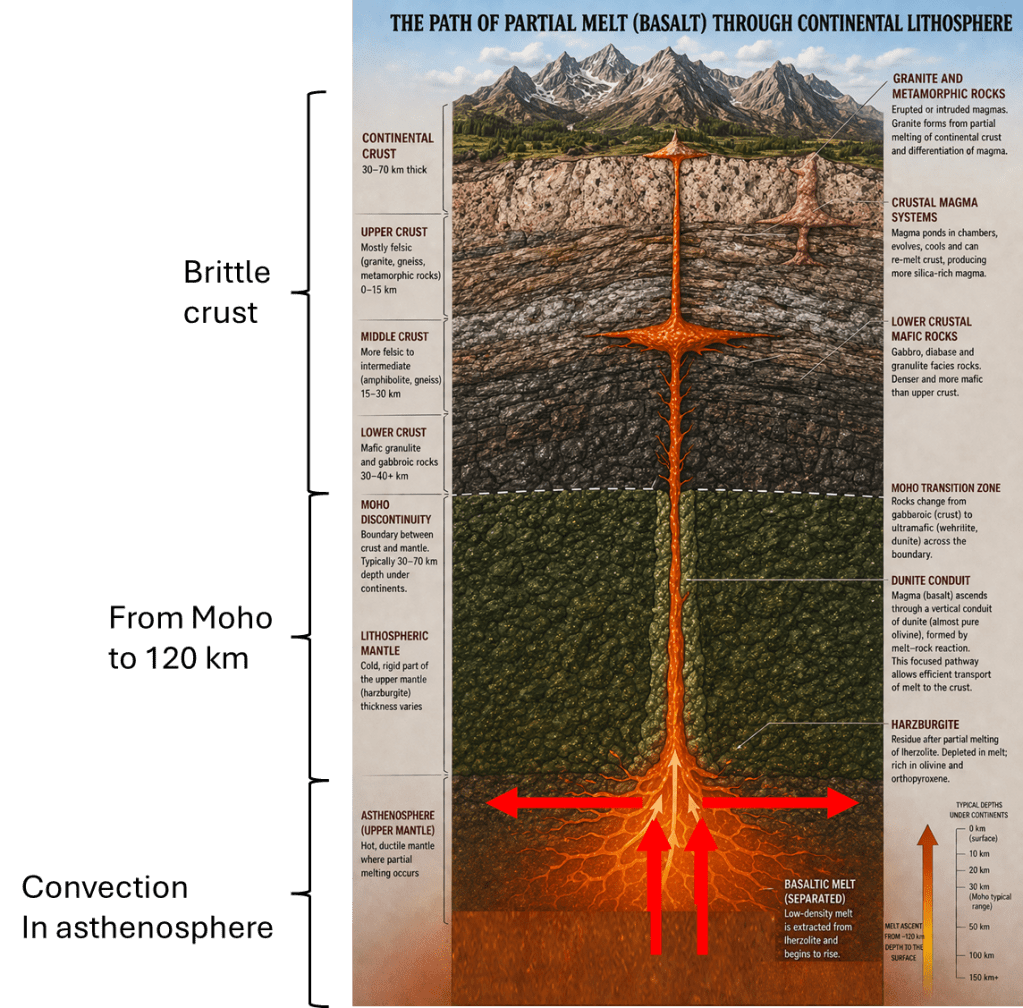
For mainland crust, the section looks slightly different for the upper most part. Again, this AI image can be made:

AI-generated cross-section of a continental plate – not to scale.

The result of this activity, which can be traced in mantle remains of ophiolites, can be detected on the surface. This is the map of Iceland:

Uncategorized

The 1.5ยฐ Spatial Sequence of Iceland

The Active South

Looking closely at southern Iceland, from the Reykjanes Ridge in the west to ร–rรฆfajรถkull in the east, a sequence of 1.5ยฐ spatial intervals can be observed. This pattern can be analyzed in detail, as many geological features align consistently within it.

Study area of South Iceland

First, the mid-ocean ridge forms a continuous structural trend, including a section approximately 900 km long. The Reykjanes Peninsula can be interpreted as a single volcanic zone, although its westernmost part represents a transition from a side-stepping arrangement of volcanic systems to a more continuous ridge structure.

Study area of South Iceland enlarged

Within this framework, a polygonal area can be identified that is densely filled with volcanic systems. A southwest (SW) division line within this polygon marks the location of the Blue Lagoon. At present, this line appears to provide a steady flow of magma into the crust, feeding a magma chamber beneath the area. When this chamber empties, eruptions occur along the Sundhnรบkur crater row.

A dike intrusion and associated surface deformation have developed along a SWโ€“NE trend, extending across much of the peninsula, from the southern coast toward the area near the road connecting Reykjavรญk and Keflavรญk Airport in the north.

To the east, the volcanic systems of Krรฝsuvรญk, Trรถlladyngja, and Hengill are aligned along the same structural trend. The eastern boundary of Hengill is marked by a clear slope known as Hlรญรฐ, after which other volcanic systems of the West Volcanic Zone (WVZ) continue along the calculated division line.

These intersections also define the western boundary of the South Iceland Seismic Zone (SISZ), which dominates the next 1.5ยฐ interval eastward, extending toward the volcano Hekla.

Hekla lies at a key boundary:

  • between the SISZ and the East Volcanic Zone (EVZ)
  • between the divergent tectonic region to the north and the volcanic but non-divergent region to the south

The southern region is therefore often referred to as the South Iceland Volcanic Belt, distinguishing it from the actively rifting EVZ. South of this lies the Westman Islands, which are sometimes treated separately, although they can also be viewed as part of a continuous volcanic system with the EVZ and the southern belt.

As in the West Volcanic Zone, the calculated division line clearly marks the eastern boundary of the EVZ. Across the region, the main volcanic systems consistently align with the pattern expected from underlying convection rolls. The division lines, their intersections, and the polygonal areas all appear to play structural roles. Even the northโ€“south and eastโ€“west axes that subdivide these polygons seem to influence volcanic behavior.

A comparable polygonal structure includes the volcanic systems of Katla and Eyjafjallajรถkull. This has both:

  • an eastโ€“west axis from Katla to Eyjafjallajรถkull
  • a northโ€“south axis running from Hekla through Vatnafjรถll to Eyjafjallajรถkull

Eyjafjallajรถkull lies at the center of this polygon. The 2010 eruption of Eyjafjallajรถkull can be interpreted within this framework: basaltic magma flowed along the eastโ€“west axis from the east into the volcano, triggering an eruption from a more silica-rich magma chamber with a lower melting point.

From the EVZ, another 1.5ยฐ step to the east leads to ร–rรฆfajรถkull, the highest volcano in Iceland. A narrow volcanic zone extends northeast from it along a division line. At this location, four inferred convection-roll division lines appear to converge. A similar structural role is observed at Grรญmsvรถtn, located to the northwest and also separated by a polygon of 1.5ยฐ span from east to west.

There are, of course, many additional details, which are explored in other posts.

Uncategorized

A Convection Roll Model of Earthโ€™s Interior: Layering and Discontinuities – and Iceland

The map used below to indicate the location of convection rolls beneath Iceland is derived from this section of the Earthโ€™s layers. Tracing the process from the consistent thickness of each layer to the exact location of the convection rollsโ€”and thereby constructing a three-dimensional model of the Earthโ€”is, of course, a complex and lengthy task. With this map, however, meaningful comparisons can be made, and a few are outlined below.

Convection roll model showing the discontinuities at 120, 410, and 670 km, along with the relevant layers;
the lower mantle contains two sets of rolls, each 15ยฐ wide.

A geological map of Iceland can then be compared with the model:

Map base: https://jokull.jorfi.is/articles/jokull2008.58/jokull2008.58.197.pdf

This map shows the location of both the Reykjanes Ridge and the Kolbeinsey Ridge. Although the map is a simplification and is neither fully accurate nor perfectly aligned with the calculated grid, a few features can still be immediately observed:

1. Volcanic zones match the grid.
Those familiar with the geology of Iceland will notice that the sharp boundaries of the volcanic zones correspond closely with the division lines between convection rolls. The distinction between upwelling and downwelling also clearly influences the distribution of these volcanic zones. Furthermore, the pattern defined by the division lines has explanatory value: the differing orientations of the East Volcanic Zone and the North Volcanic Zone are consistent with the distinct grid patterns observed in the southern and northern halves of Iceland.

2. Seismic zones match the grid.
The South Iceland Seismic Zone, as identified through geophysical measurements, is located between Hekla and Hveragerรฐi, precisely within one of the polygons defined by the grid. The Tjรถrnes Fracture Zone also aligns with the division-line pattern observed along the northern coast.

3. Distribution of geothermal areas.
The distribution of geothermal areas also corresponds with the model. Low-temperature areas are associated with specific polygons and tend to cluster within them. In contrast, high-temperature areas are associated with division lines, their intersections, and the boundary between the Eurasian Plate and the North American Plate.

4. Local tectonic alignment within polygons.
Tectonic features within the polygons, such as volcanic fissures, are aligned according to the geometry of each polygon, reflecting the structure imposed by the convection rolls. These alignments do not follow the general direction of plate motion, suggesting that the model explains a major structural trend not accounted for in previous models.

5. NWโ€“SE and NEโ€“SW fissure patterns.
In some cases, fissures exhibit a NWโ€“SE alignment consistent with the mirrored structure of the underlying convection rolls. Different layers display different roll orientations, while maintaining symmetry relative to the northโ€“south axis. The coexistence of NWโ€“SE and NEโ€“SW trends has not been satisfactorily explained by other models.

Many additional aspects of consistency between the model and surface expressions have been discussed here.