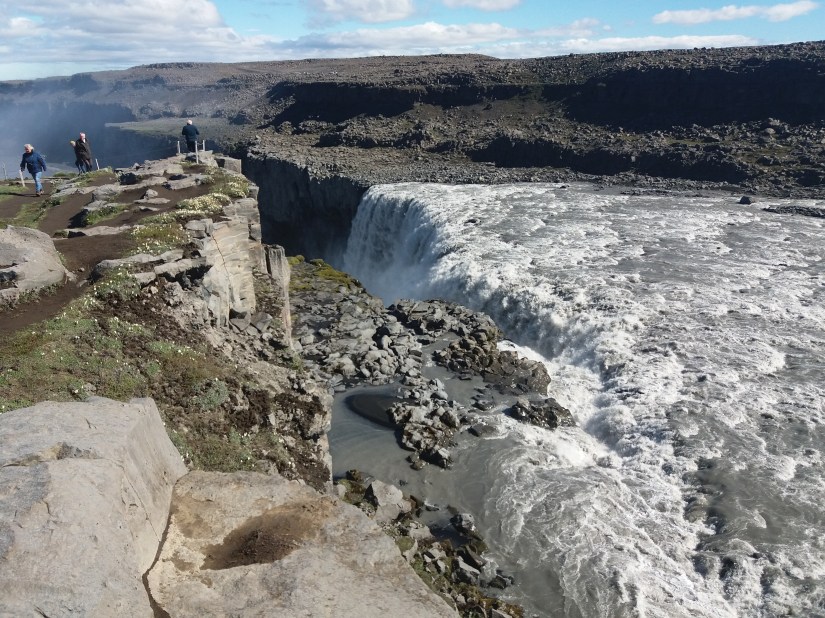
Dettifoss is the most powerful waterfall of Europe. The settings can be described as such: The river Jökulsá á Fjöllum does flow northwards, as the north volcanic zone of Iceland is aligned north-south. The edge of the waterfall is aligned N34°E. Why?
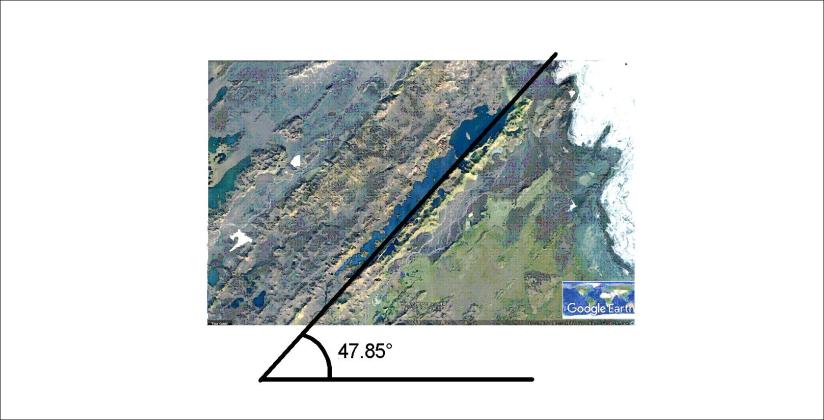
According to this analysis, Dettifoss is on the same line as the volcano Hekla! Here you see the waterfall and the relevant rift:
From above it looks like this on Google map:

Dettifoss
The calculated value of direction of mantle convection rolls is the the same as that of the edge of the waterfall. As Dettifoss is on the latitude of 65.8°N, the calculated value becomes 56° angle from EW-axis.
Note that in the south of Iceland the direction of the volcanic zones is calculated with this formula. In the north of Iceland the symmetry of the magma currents of different layers does lead the zone directly northwards, but the direction of upper most NE-trending convection rolls still appear with the tectonics of the area.
The manifestations of how the magma currents shape the surface are endless!
Just to show the amazing possibilities this gives us to understand the environment better, just have a look at the other two waterfalls in the area, Hafragilsfoss and Selfoss.
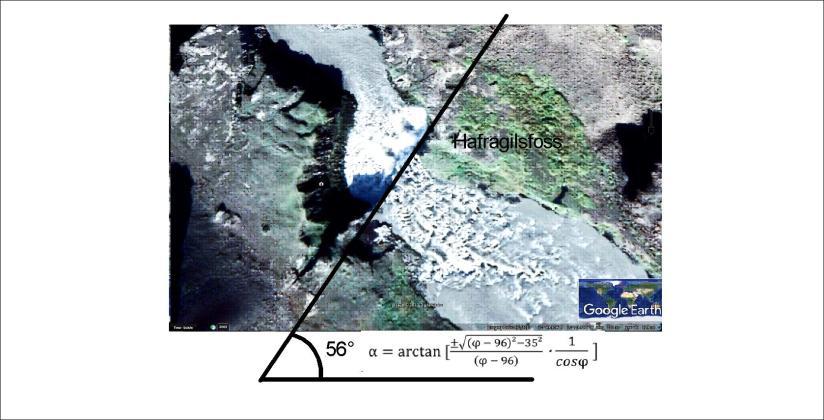
Hafragilsfoss is directed in exactly the same way as Dettifoss. It is easy to understand as the main upwelling division line of convection rolls passes through this area and is exactly oriented in the same direction.
But underneath there is another layer of convection rolls with opposite orientation. The next waterfall above Dettifoss is Selfoss, and the alignment of its edge can also be calculated!

It is all the same formula showing us all this. These calculations can of course be utilized for many purposes once this method becomes common knowledge.
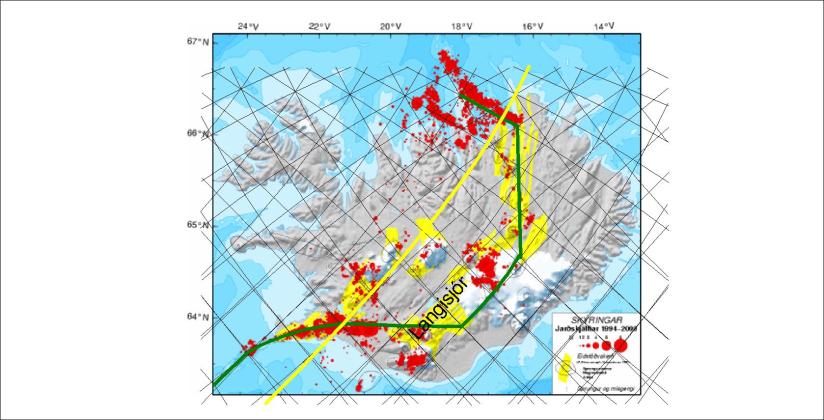
Just to clarify this further, the position is shown on the map from Náttúrufræðistofnun and Orkustofnun.

Being found along the continuation of the line of Hekla, with the correct alignment, it is a good example of how the convection cell system works.

The ruling convection rolls division line extends from Hekla to the vicinity of the three waterfalls. Mathematics explain it all!
 Faxi is not far from Gullfoss and Geysir and has been seen by many on the so called Golden Circle Tour. Again, the alignment of the waterfall is a curiosity. The river Tungufljót makes a turn and forms a waterfall over the cliffs almost in the opposite direction of the river. This feature can be calculated, as the cliffs follow the orientation of convection rolls. This is best shown with a Google map and the relevant drawing and formula:
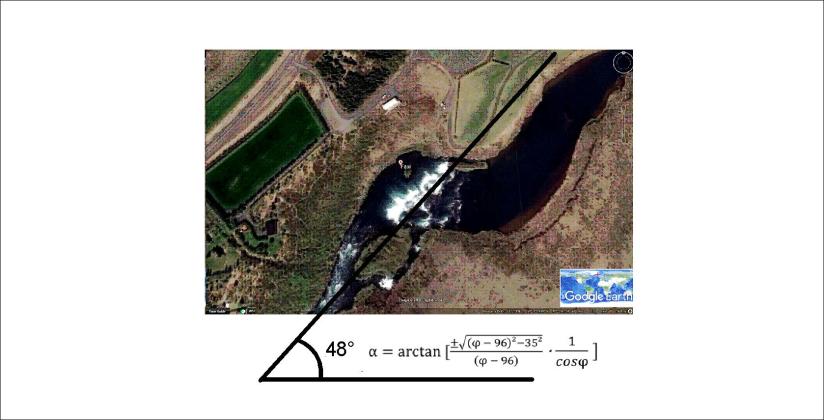

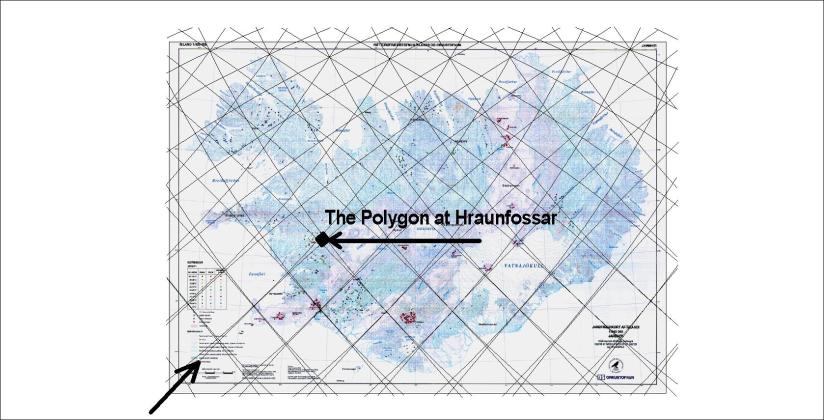
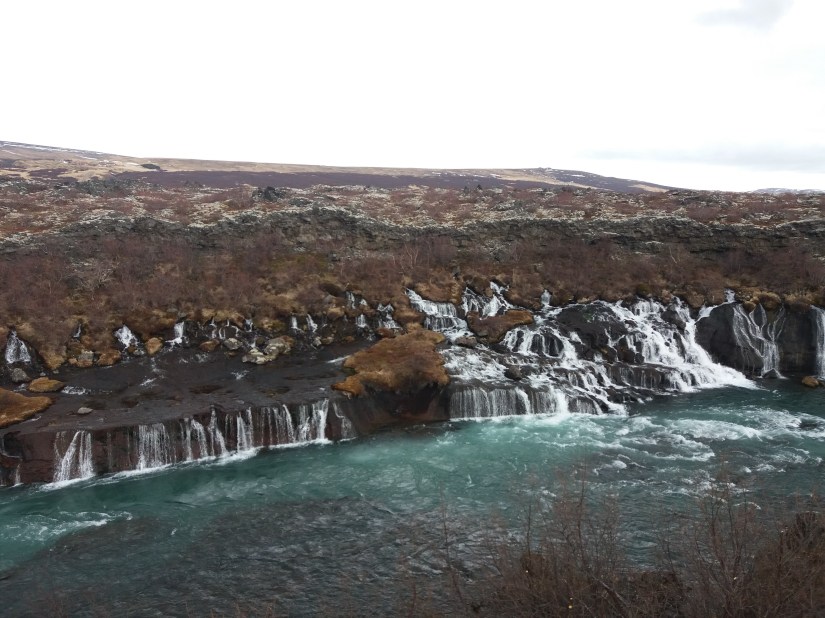 Hraunfossar – the waterfall of no river above it! The beauty and special settings of Hraunfossar can be partly explained. First we have to have in mind its position compared to the convection cell grid, as shown here on the base of a map from Náttúrufræðistofnun and Orkustofnun: