Uncategorized

Geothermal Activity in Bulgaria – some preconditions

Most geothermal activity in Bulgaria is concentrated in the southwest of the country. By comparing mantle structure with the distribution of geothermal fields, it is possible to construct a simple explanatory model.

The southwest region is influenced by two opposing forces: on one hand, the general tectonic drift of the Eurasian Plate, and on the other, the counteracting effect of a mantle convection roll beneath the area. This opposition leads to rifting, which explains the geothermal activity around Velingrad and other sites. The Struma Valley marks the western boundary of this zone and includes Sapareva Banya, the hottest hot spring in Europe. When a phenomenon is exceptional—such as being the hottest or largest—it suggests that special geological conditions must be present. In this case, the nearby subduction of the Adriatic Plate beneath the Balkan Peninsula likely alters the regional stress field, creating the unusual geothermal regime observed both along the dividing line above and across the wider area marked in red on the map.

The east–west axis of the Balkan Mountains and the geothermal utilization hub near Varna are also shown on the map. While Varna’s use of shallow heat sources can partly be explained by its dense population, its location is also significant in light of the mantle-flow analysis.

This situation can be compared to Iceland, where volcanic zones about 1.5° wide (east–west) form directly above distinct mantle convection rolls. The East Volcanic Zone in southern Iceland (SIVZ) is a rift system, pulled towards the NW by the movement of the North American Plate. At the same time, the convection roll beneath it drives mantle flow in the opposite direction, thereby causing the rifting. Similarly, west of the Struma Valley, a zone of the same width has developed, representing a rift zone of the same type as the SIVZ. The recurrence of such 1.5°-wide zones strongly suggests that their formation is governed by the dynamics of a convection-roll system.

For reference. How the volcanc zones of Iceland appear in context with the convection rolls system drawn underneath.

Uncategorized

The Relative Tectonic Drift Between Africa and Eurasia

Looking at the modern GPS based map representing tectonic drift vectors, it looks like Africa and Eurasia are more and less drifting in a parallel way:

Looking at the Mediterranean and its surroundings, it is obvious that the African plate is being subducted below the Eurasian plate. The relative movement between those two plates consists therefore mainly of a northward component. The convergent boundaries are quite complex, as can be seen here:

This is a clip from the presentation found at: https://www.youtube.com/watch?v=cqK-CbuM3Eo (Geoscience Information for Teachers Workshop at EGU).

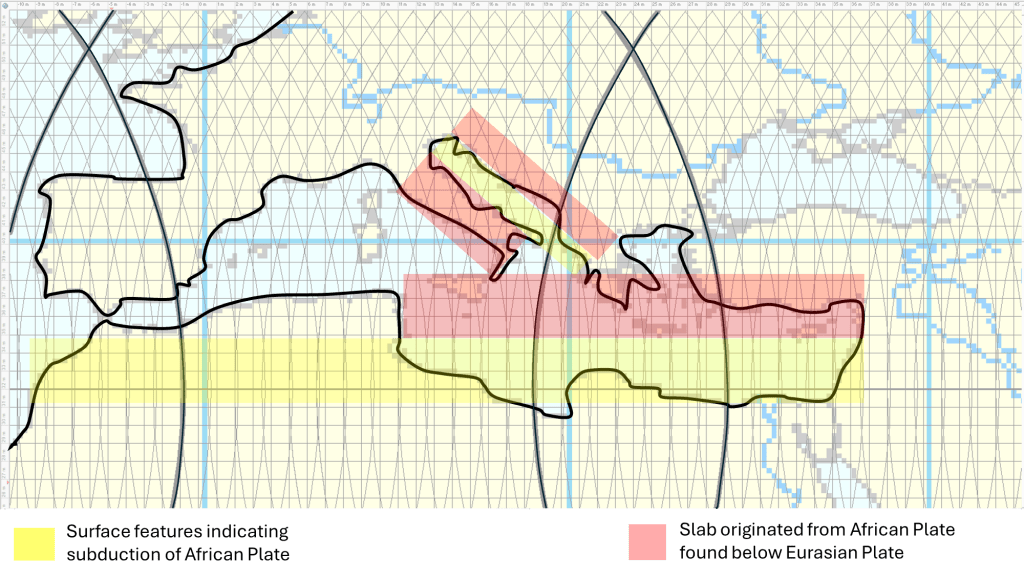
If we try to simplify this as much as possible, the two main features of the North Coast of Africa, and the Adriatic Sea should be looked at:

It is known that Italy has rotated and the Adriatic Sea has thereby been enclosed with slab reaching under both Italy and the Balkan Peninsula. The African Plate subducts below the Aegean Sea, Sicily and Turkey. Subduction from the north and the appearance of ocean floor due to spreading is omitted here. The lines resulting from the Convection Rolls Model can be seen, and of course the main purpose of this study is to compare that model with what is known about the geology of the area. For this short post, it is mainly pointed out that the North Coast of Africa coincides with the 32nd parallel where the convection rolls are aligned directly N-S. One aspect of that latitude is that two downwelling lines of two different layers coincide, and thereby also two upwelling lines of two layers coincide. This creates the opportunity for convergent boundaries to appear, if the downwelling part is the dominant factor (no-slip) and the upwelling part becomes neutral (slip). A consequence of this is that extension within the area is then mainly caused by the north component of drift of the Eurasian Tectonic Plate, as the subduction is mainly related to the conditions close to 32°N.

Uncategorized

The circular tectonic drift vectors of Anatolia

The tectonic drift of the Anatolian Plate is notably independent from its surroundings. While the Arabian Plate moves northward, similar to the African Plate, the Anatolian Plate exhibits a counterclockwise rotation. This motion can be examined through the lens of the convection rolls model to see whether it offers any additional insights. The outcome is striking and reveals two key points:

  1. The combined structure of convection rolls and plate boundaries appears to create the conditions for a central pivot point around which the Anatolian Plate rotates.
  2. If a fixed point within the convection model exerts a dominant influence on tectonic drift, then the convection rolls also offer a framework for understanding the subduction of the African Plate beneath the Eurasian Plate.

The map showing drift vectors can be found at:
https://www.tandfonline.com/doi/full/10.1080/19475705.2024.2446588#abstract

The most significant observation is that this central pivot lies near the 32nd parallel, precisely where two mantle upwelling lines intersect at approximately 32.1°E. Along this latitude, the convection roll system is aligned exactly north–south, making it a key structural feature, comparable in importance to the equator and the 64°N/S parallels. Interestingly, this location corresponds roughly to the eastern edge of the Nile River delta. It has previously been noted that the deltas of the world’s largest rivers—especially the Amazon at the equator—are situated at critical junctions within the convection rolls framework. https://magicmagma.com/2022/10/04/what-do-the-three-famous-rivers-amazon-nile-and-mississippi-have-in-common/

Given this fixed relationship between surface tectonics and mantle convection geometry, the concept of rollback requires reconsideration. In this case, the European continent appears to be drifting away from the latitude at which the African Plate subducts beneath it. Whether we interpret this as northward retreat of the African slab or northeastward drift of Europe, the geological consequences are functionally the same.

The side-view depiction of African Plate subduction shows how numerous geological features have developed over the last 35 million years, since subduction began. These reflect the continuing northeastward movement of the Eurasian Plate, while the northern edge of the African Plate descends beneath it.

This is from https://www.youtube.com/watch?v=cqK-CbuM3Eo

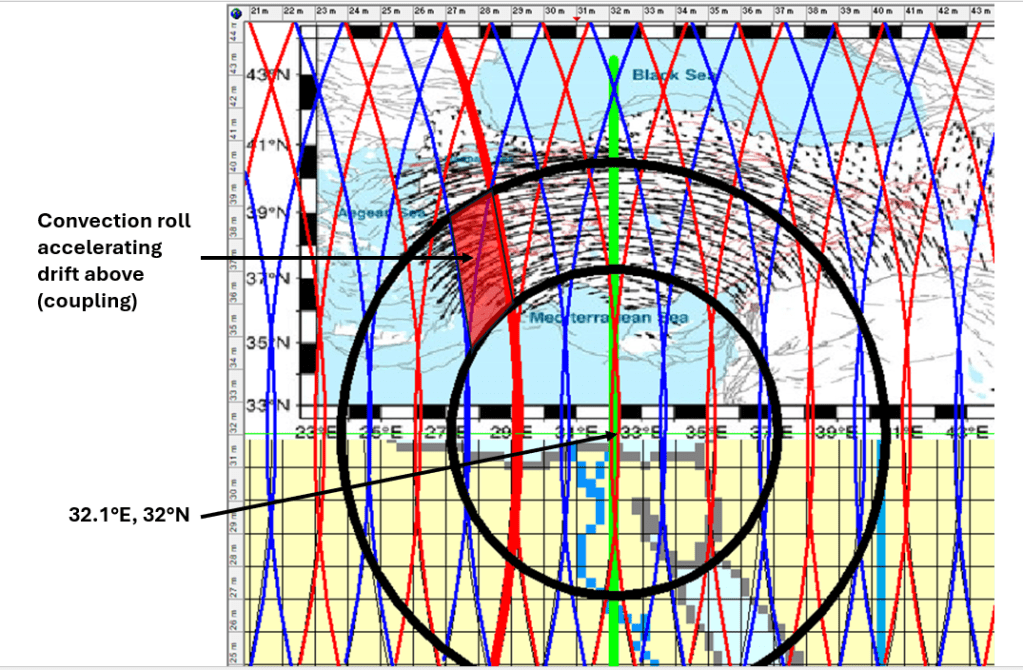
Just to clarify a bit what drives the tectonic drift anomaly of Anatolia, a particular bit of convection roll can be pointed out:

It can also be pointed out that most geothermal activity is found in this part of Turkey. Take a look at this map:

It is from https://www.researchgate.net/figure/Geothermal-map-of-Turkey-MTA-2021b_fig1_365230456

The red area in Western Turkey coincides with the convection roll taking part in driving the rotation of the local tectonic plate. This can explain the geothermal activity anomaly.

Note that the appearence of the aggregate of vectors of GPS drift measurements of the Anatolian Peninsula is not only circular, but also basicly from east to west. The mathematical precision of the drift can only be possible because of a very regular system of convection rolls underneath. The rolls following the drift are coupled to the layers above, the ones opposing are decoupled. Thereby the engine driving this interesting rotational drift of the plate can be explained thoroughly.

Just to clarify further how the convection rolls move the tectonic plate, this drawing is added:

The red areas provide force for the circle to move anti-clockwise in an almost circular way. As previously mentioned, the pivotal point is also a key point within the convection rolls system as a whole, due to the exact N-S alignment of convection rolls at the 32nd latitude.

Uncategorized

Katla Ice Cave in a wider context

A famous eruption occurred in 1918 of Katla Volcano in South Iceland and triggered the largest flood known on Earth in recent times. Today, a river flows through the area, called Múlakvísl. The very root of that river is originated from an ice cave, known as the Katla Ice Cave in the tourist industry. This is the opening of the cave:

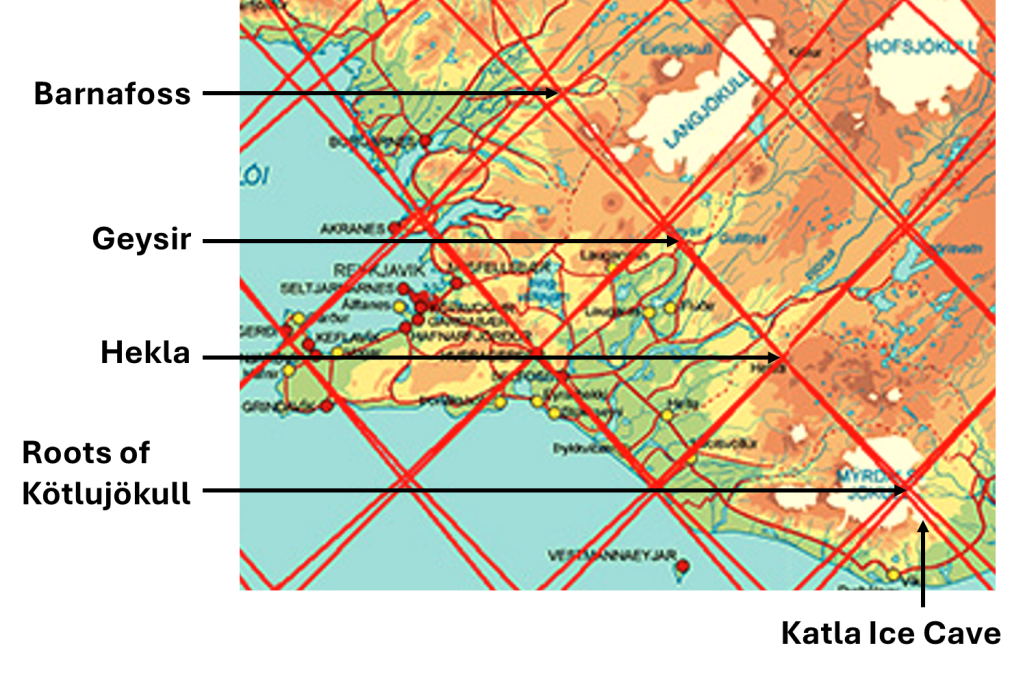
The location of the glacial toungue of Kötlujökull can be studied on this map:

Looking closer at Kötlujökull, we find the location of the cave opening:

The most interesting sites are there for a reason. In the case of Kötlujökull, the inner forces meet with the outer forces of snow, ice and water flow. Here the similar conditions for shaping Barnafoss, Geysir and Hekla are mentioned. Barnafoss is shown here below:

Uncategorized

Can the Convection Rolls Model Help Identify Geothermal Resources?

Systematic measurement and compilation of data form the foundation of scientific work. However, over time, such efforts can also foster new perspectives on existing information—perspectives that may lead to fresh discoveries and innovation. Geothermal exploration relies on a range of data: knowledge of fractures, heat gradients, aquifers, thermal conductivity, surface water chemistry, and more. Based on this information, a well is drilled, and if conditions are favorable, hot water can be extracted from the ground.

The Convection Rolls Model offers an additional, indirect method to complement these approaches. By understanding tectonic drift vectors and recognizing that the boundaries between mantle convection rolls also influence divisions within the overlying tectonic plates, we gain a new framework for selecting promising geothermal sites. Iceland provides a compelling case study.

The map below shows the distribution of high- and low-temperature geothermal areas in Iceland. High-temperature zones are typically located near the boundaries of convection rolls, with a strong spatial correlation. In contrast, low-temperature zones tend to cluster within defined polygonal regions, also showing resemblance with the convection roll structure.

Map from Náttúrufræðistofnun Íslands, (Icelandic Institute of Natural History).

To identify new geothermal sites, a logical first step is to explore the intersections of convection roll boundary lines. Next, examining the distribution of known geothermal sites within the defined polygons may reveal consistent patterns — patterns that could guide the discovery of additional sites. However, this approach should be used in conjunction with established geological exploration methods to minimize the risk of error. The map, along with its scientific foundation, serves as a complementary tool to enhance the efficiency of land-based geothermal prospecting.