I am a geologist, graduated from the University of Iceland, and taught geology for a few years. I have gained some knowledge about Earth's inner structure, so I provide this website as my contribution to answer one of the greatest questions remaining within the realm of geoscience. Experiments show that the mantle should form convection rolls when close to the melting point. I took this literally, and calculated the dimensions and shape of these mantle convection rolls. Then I compare that model with the surface. This makes it possible to provide many interesting examples about geology found on my blog.
Around 3 million years ago, a volcanic zone developed in the Skagafjörður region, extending across what is now the Skagi Peninsula in northern Iceland. This area was part of the Neovolcanic Zone at the time — the active rift that carried most of Iceland’s volcanic and tectonic activity.
For roughly 2–2.5 million years, the Skagafjörður volcanic system produced extensive basaltic lava flows, which now blanket the Skagi Peninsula. These lava layers form a thick sequence of Pleistocene basalt plateaus, showing clear evidence of successive fissure eruptions and long-lived rift activity.
The Skagafjörður volcanic zone formed approximately 3° farther west, but at the same latitudes as the present-day Northern Volcanic Zone. This spatial relationship is not coincidental: it reflects the underlying mantle convection pattern. In Iceland’s mantle, long convection rolls extend roughly 1.5° in width from east to west. These rolls guide upwelling zones and determine where rifting and volcanism are concentrated at the surface.
Thus, both the Skagafjörður and Northern Volcanic Zones are expressions of the same large-scale convection pattern — successive manifestations of upwelling between the same pair of convection rolls, but active at different times as the spreading axis gradually shifted eastward.
Volcanic activity in Skagafjörður ceased less than 700,000 years ago, marking the end of its active phase. By then, the rift axis had shifted eastward and thereby replaced by the current Northern Volcanic Zone. During the active period of the Skagafjörður system, tectonic drift continued, resulting in approximately 10 km of crustal extension. This stretching contributed to the widening of Skagafjörður, later sculpted by glaciers into the broad fjord we see today.
The Skagi Peninsula, now far from any active volcanic centers, remains a silent geological record of this earlier rift episode — a remnant of the same convection-driven dynamics that continue to shape Iceland’s landscape today.
The two NS-axis of Iceland – old and new
Here you see the light blue colored area of Skagi, isolated from other volcanic areas.
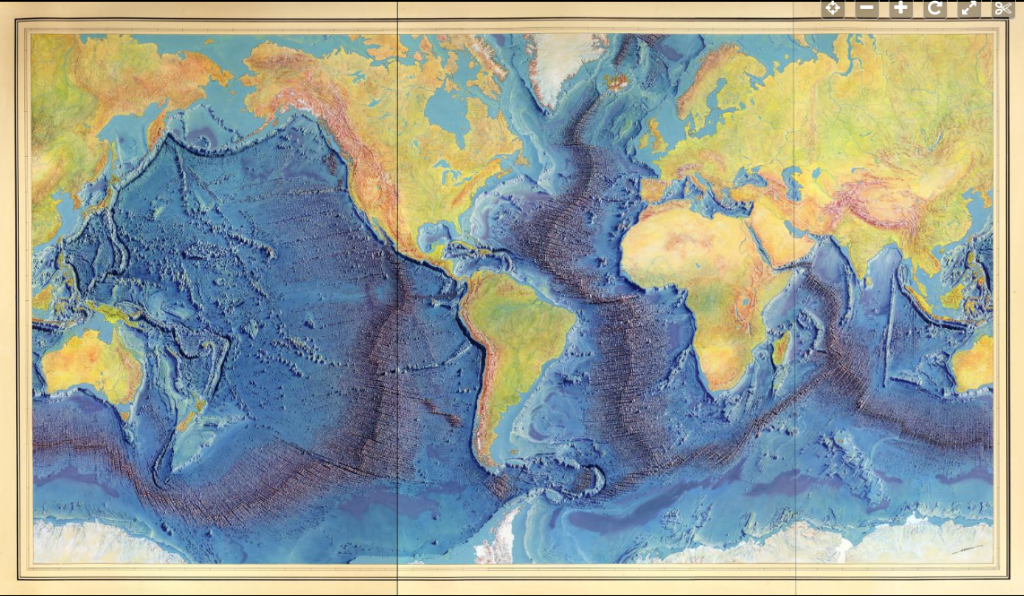
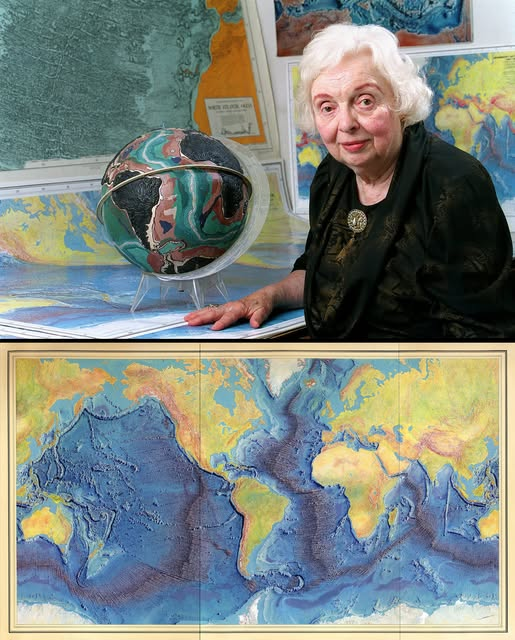
Mary Tharp was a pioneering geologist and oceanographic cartographer who, together with Bruce Heezen, created the first comprehensive maps of the ocean floor. Her work revealed the global mid-ocean ridge system, a continuous chain of underwater mountains stretching around the planet, and provided some of the first convincing visual evidence for plate tectonics.
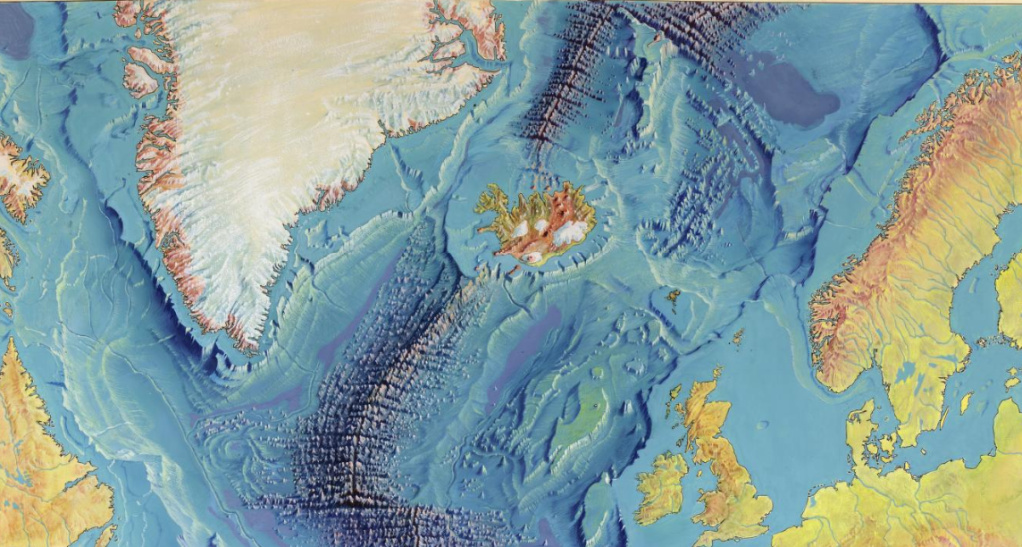
This painting is still the clearest depiction I know of the ridge system. When zooming in on the ridges around Iceland, we can clearly see that a continuous structure lies beneath the island: the Reykjanes Ridge to the south and the Kolbeinsey Ridge to the north, separated only by Iceland and the Icelandic shelf.
It is also fascinating to look at the globe Tharp and Heezen created, where the ridges are marked all around the world. Seeing the system on a sphere makes it much easier to grasp how continuous these features really are, something that is very difficult to comprehend on a flat map. Creating a globe like that must have been a crucial part of their work, helping them visualize Earth’s dynamic structure as a truly interconnected system.
1977: The culmination of Tharp’s decades of work came with the publication of “The World Ocean Floor”, a full world map of the ocean ridges, created in collaboration with artist Heinrich Berann. This was the first global visualization of the continuous mid-ocean ridge system encircling the planet.
Of course it is tempting to add some aspects of the convection rolls model here:
t’s hard not to be impressed by the remarkable regularity of the pattern — at once striking, convincing, and precise. The main structural divisions appear at consistent 30° intervals, outlining a symmetry that is anything but coincidental. Even with the thinnest possible lines, the geometry stands out clearly: the 30° spacing traced along the equator, the continuous arc of the Ring of Fire encircling the Pacific Ocean, and the 90° separations linking the major mid-ocean ridges across the Southern Hemisphere. Together, these alignments suggest a coherent global framework — a kind of planetary rhythm — that underlies both surface geology and deeper mantle dynamics.
The 64th parallel intersects some of Iceland’s most significant volcanic and geothermal centers, including Hekla, Landmannalaugar, and Öræfajökull, which line up remarkably well along that latitude, about 3° of longitude apart. Let’s now trace the 64th parallel north (64°00′ N) carefully from west to east.
Tracing 64° N, Iceland
1. Western Start — Reykjanes Peninsula (22°–21° W)
The 64th parallel enters Iceland at the southern Reykjanes Peninsula, intersecting the Reykjanes Volcanic Belt, the onshore continuation of the Mid-Atlantic Ridge.
Svartsengi (Blue Lagoon) — high-temperature field exploited for power and bathing.
Krýsuvík — intense fumaroles and sulfur deposits along faulted rhyolite ridges near Lake Kleifarvatn.
Volcanism: Basaltic fissure eruptions, most recently the Fagradalsfjall events (2021–2024), lie within a few kilometers north of 64° N.
2. Hengill and Hveragerði Region — Western End of SISZ (21° W)
At 64° N, the parallel runs just north of Hveragerði and crosses the Hengill volcanic system, a major geothermal center and the western terminus of the South Iceland Seismic Zone (SISZ).
Geothermal:
Hellisheiði and Nesjavellir plants utilize the Hengill field; production wells reach >300 °C.
Surface features include fumaroles, silica terraces, and mud pots in Hveragerði valley.
Tectonics: The SISZ runs eastward from here to Hekla (~19.5° W), spanning roughly 1.5° of longitude, as you noted.
It’s a transform zone, accommodating lateral spreading between the Western and Eastern Volcanic Zones.
3. South Iceland Seismic Zone (SISZ) — Between Hveragerði and Hekla (21°–19.5° W)
At 64° N, the line traverses the seismically complex Hreppar microplate.
Numerous NNE–SSW strike-slip faults and en-échelon fissures characterize this belt.
Though volcanic activity is minimal, earthquakes (M 6–7 historically) are frequent.
Geothermal springs occur near Flúðir and Laugarvatn, used locally for heating and bathing.
4. Hekla Volcano (19.7° W)
At precisely 64.00° N, 19.7° W, lies Hekla, Iceland’s most active stratovolcano.
Type: Elongate ridge volcano, 1491 m high.
Eruptive behavior: Mixed basaltic-andesitic, with both explosive and effusive events; last eruption in 2000.
Structure: A central fissure system about 40 km long trending SW–NE.
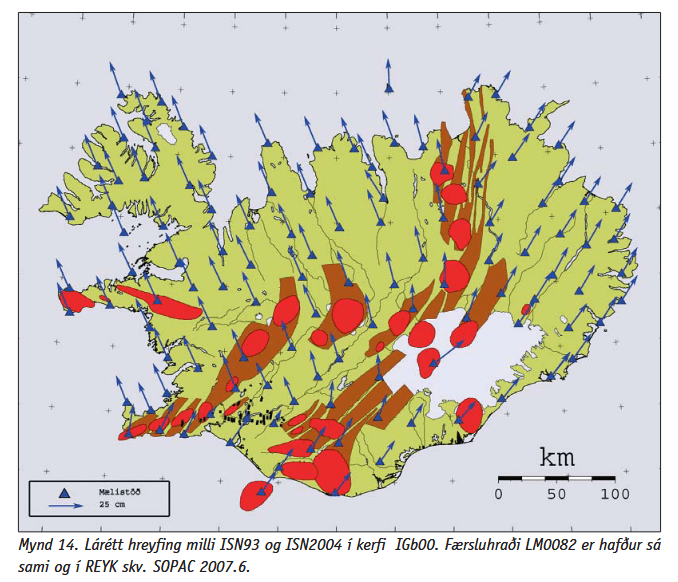
The data clearly indicate that the overall horizontal plate motion across Iceland is directed predominantly towards the north. Furthermore, the velocity field demonstrates that the plate motion in northern Iceland is approximately symmetric with respect to the north–south axis: motion vectors on the Westfjords are oriented toward the northwest, whereas those on the Eastfjords are oriented toward the northeast. The vectors on both sides of the island form nearly identical angles relative to geographic north.
The figure is based on the original measurement data and therefore represents the true directions of crustal motion. The displacement rates were derived using the SOPAC velocity field at epoch 2007.6, under the assumption that the motion at station REYK is equivalent to that observed at LM0082. Consequently, the figure provides a realistic depiction of the current kinematic framework of Iceland.
The magnitude of the plate motion is notably greater than commonly assumed. On the western part of Iceland, the motion typically reaches close to 2.5 cm/yr towards the northwest and the northeast, as shown (see arrow at lower left corner on the map, showing the length of 25 cm in 10 years). On the other hand, the spreading rate between the North American and Eurasian plates—i.e., the rate of divergence across the rift zones—is approximately 2 cm/yr. It is important to distinguish between absolute plate motion and spreading rate: while the total drift relative to a stable reference frame is on the order of 2.5 cm/yr on each side, the divergence between the two plates amounts to roughly half that value. Many descriptions of Icelandic tectonics cite about 1 cm/yr of motion to the west and 1 cm/yr to the east; however, these represent the half-spreading rates rather than the absolute plate velocities observed in geodetic measurements.
The two different drift trends at the eastern and western sides of Iceland can also be seen on this map from Wikipedia.
Geodetic networks such as ISNET have been instrumental in quantifying this relative motion and in delineating the internal deformation of the island. The observed symmetry in motion across northern Iceland reflects the geometry of the ridge system, with extension distributed among several rift zones and connected by major transform fault systems, including the South Iceland Seismic Zone and the Tjörnes Fracture Zone. These results are consistent with the regional plate-tectonic model and provide refined constraints on the present-day strain field within the Icelandic plate boundary zone.
The long-term stability of Earth’s internal temperature presents one of the most fundamental challenges in geophysics. If the mantle behaves adiabatically below approximately 120 km depth, as seismic and experimental evidence suggests, then its temperature should remain nearly constant through time. Under these conditions, the balance between internal heat generation and total surface heat loss must be remarkably precise.
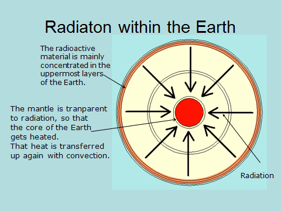
Radiation reaching the core.
In Earth’s early history, the quantity of radioactive elements such as uranium, thorium, and potassium was significantly higher, producing far greater radiogenic heat than at present. This excess energy would have been released through more vigorous mantle convection, enhanced volcanic and tectonic activity, and greater rates of heat transfer through the lithosphere. The total surface heat flow during that period must therefore have exceeded today’s ~47 terawatts (TW). Although the magnitude of these variations can be estimated from isotopic decay rates and thermal evolution models, the exact contributions of each geological process remain uncertain.
Despite these temporal fluctuations in radiogenic power and heat loss, the average mantle temperature appears to have remained nearly constant throughout Earth’s history. This implies a long-term self-regulating thermal system, in which higher heat production automatically enhances convective and radiative efficiency, maintaining near-adiabatic conditions and preventing significant temperature drift over geological time.
This stability suggests that the Earth’s internal heat budget operates as a closed but dynamic system, governed primarily by the amount and distribution of radiogenic elements and by the efficiency of internal heat transport processes.
Geoneutrino Constraints and Radiogenic Uncertainty
Recent geoneutrino measurements provide valuable insight into radiogenic heat production. These antineutrinos, emitted during the decay of uranium and thorium, allow researchers to estimate total radiogenic power. Current analyses suggest roughly 20 TW of heat is generated radiogenically, but this value carries large uncertainties due to limited detector coverage—most instruments are located on continental crust—and the need to extrapolate mantle contributions from sparse data.
If mantle concentrations of radioactive elements are higher than currently assumed, the true global radiogenic power could approach or even match the 47 TW of measured total surface output. This would reconcile the apparent imbalance between heat production and heat loss. Thus, the prevailing 20 TW estimate should be regarded as a lower bound, pending improved geoneutrino constraints from oceanic and deep-mantle observation sites.
Reconsidering Heat Transport in the Mantle
The conventional model envisions mantle convection as a primarily upward heat-transport system, carrying thermal energy from the interior toward the lithosphere. While this captures the dominant mechanism, it neglects a complementary and critical component: thermal radiation, which can transmit energy in any direction permitted by local gradients, including downward toward the core.
At the extreme pressures and temperatures near the core–mantle boundary, the mantle’s mineral phases cannot retain stable crystalline structures. The intense radiation field continuously destabilizes any emerging crystals, preventing their persistence and leaving the material in a vitreous, radiation-permeable state. Under these conditions, thermal radiation from the overlying mantle can pass almost undisturbed. Consequently, a portion of the mantle’s internal energy, instead of being entirely convected upward, is radiated downward into the core, effectively heating the core from above.
In contrast, convection transfers heat upward through the large-scale motion of mantle material: hotter, less dense regions rise, while cooler, denser regions sink. These convection rolls maintain global circulation and determine the spatial distribution of surface heat flow. Their geometry, wavelength, and coupling between different mantle layers provide the mechanical framework through which this energy is released.
Together, these two complementary processes—radiative transfer downward and convective transport upward—define the mantle’s dual role in Earth’s thermal system. The lower mantle acts as a radiatively transparent medium, facilitating energy exchange between the mantle and core, while the upper mantle remains convectively active, ensuring efficient heat release toward the surface. This dual mechanism explains how the mantle can sustain an adiabatic thermal gradient over geological timescales, maintaining both the activity of the core and the global tectonic system.
Implications for Earth’s Thermal Evolution
If downward-directed radiation continuously supplies heat to the outer core, then the core’s thermal history may be influenced not only by its own decay heat and latent crystallization, but also by a persistent influx from the mantle. This would help maintain the geodynamo over billions of years and explain why the core remains partially molten despite the decline in radiogenic elements.
The result is a self-regulating thermal system: radiative transfer prevents the mantle from cooling too rapidly, while convective circulation stabilizes surface heat loss. The two mechanisms together preserve a long-term thermal equilibrium that is more intricate and stable than models based solely on convection and conduction.
In this framework, Earth’s internal energy balance is dynamically self-sustaining, with the mantle acting simultaneously as the conveyor and the moderator of heat flow. Recognizing the interplay between radiative and convective processes is therefore essential for understanding the persistence of Earth’s internal heat, the endurance of its magnetic field, and the continuing vitality of plate tectonics.






 Magic Magma