Uncategorized

How to make a simple analysis?

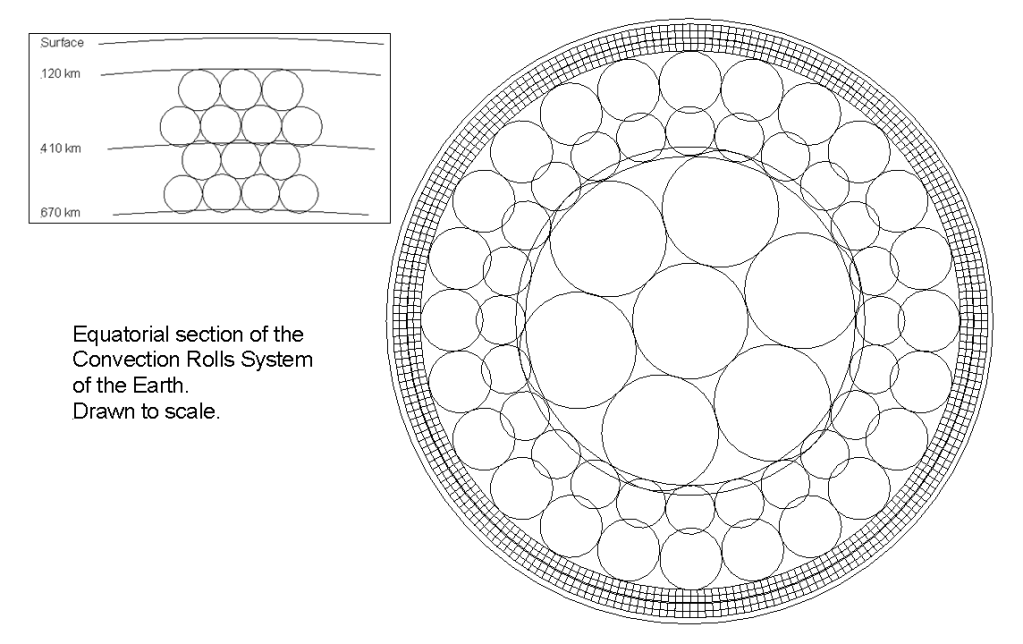
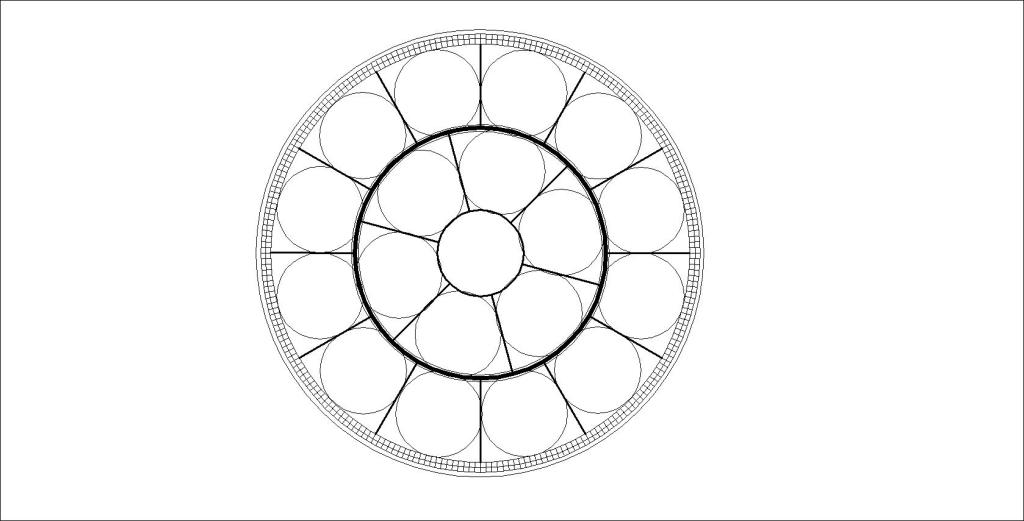
All of this begins with a drawing found all over, a simple section of mantle rolls. Basically, those are two circles turning in opposite direction against each other:

From wikipedia: https://en.wikipedia.org/wiki/Mantle_convection

This is simple, accepted as a guess, though. Analysing this is a bit more complicated than one might think at first. Here is an example of how to handle that:

I — FOUNDATIONS


Chapter 1 — The Making of a Model

  • 1.1 Plate tectonics as a descriptive model
  • 1.2 Mantle plumes vs global structure
  • 1.3 Missing geometry in geoscience
  • 1.4 The need for a unifying framework
  • 1.5 Observational inconsistencies

Chapter 2 — First Observations of Order

  • 2.1 Iceland as a key to global structure
  • 2.2 Regular spacing of volcanic zones
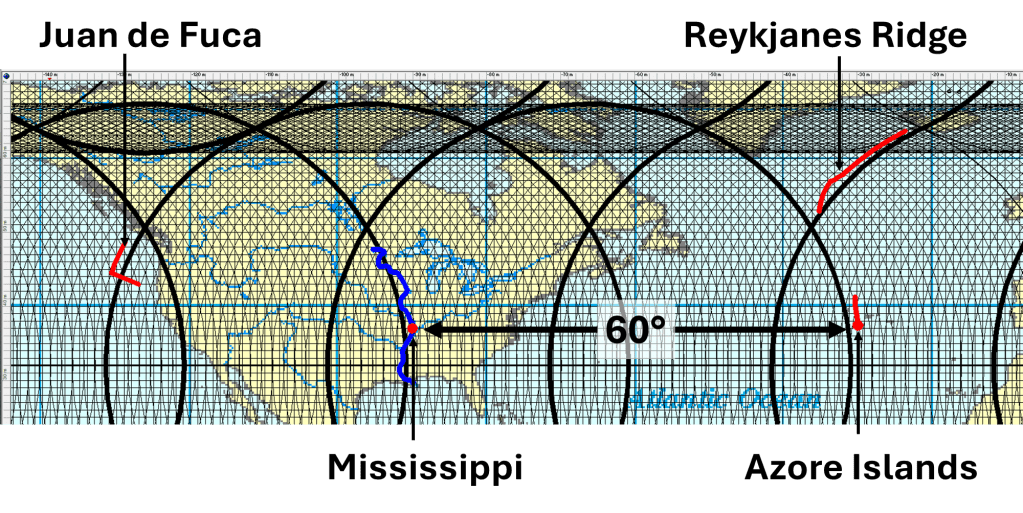
  • 2.3 The 30° and 90° patterns
  • 2.4 Symmetry across hemispheres
  • 2.5 The Ring of Fire as a system

Chapter 3 — From Observation to Hypothesis

  • 3.1 Recognizing repeating units
  • 3.2 The idea of convection rolls
  • 3.3 Linking surface features to deep structure
  • 3.4 Early geometric interpretations
  • 3.5 Formulating a testable model

II — THE CONVECTION ROLLS MODEL


Chapter 4 — The Mathematical Framework

  • 4.1 The global equation of mantle rolls
  • 4.2 The 1.5° discretization
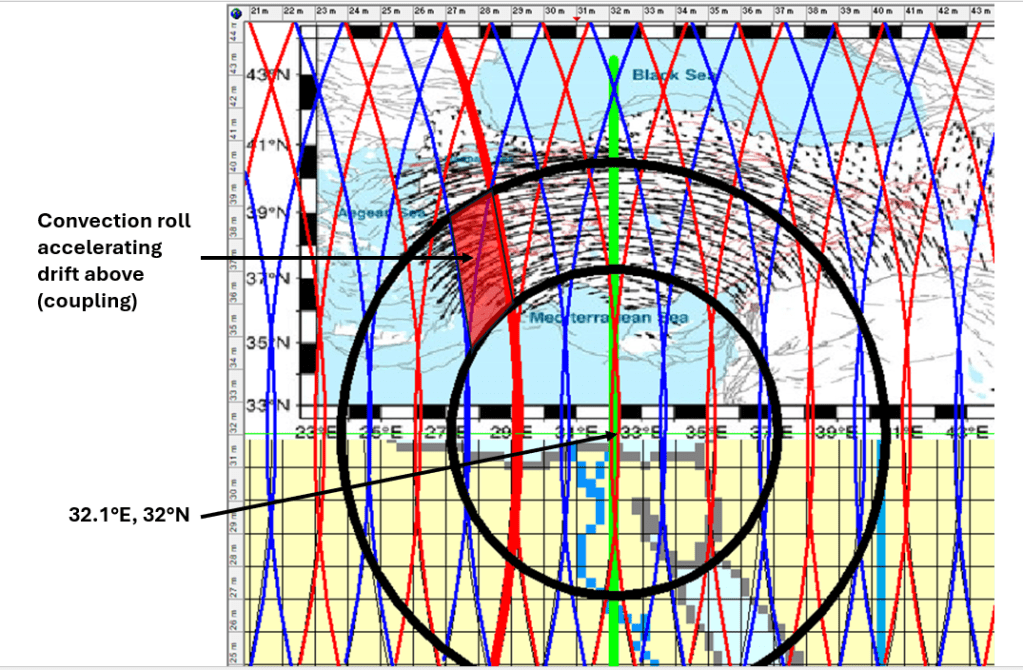
  • 4.3 The role of latitude (32°)
  • 4.4 Directional equations
  • 4.5 Spherical corrections

Chapter 5 — Vertical Structure of the Earth

  • 5.1 Earth’s layered structure
  • 5.2 120 km, 410 km, 670 km discontinuities
  • 5.3 Equal height–width condition
  • 5.4 Rayleigh-Bénard convection in Earth
  • 5.5 Stability of convection rolls

Chapter 6 — Global Distribution of Mid-Ocean Ridges

  • 6.1 Ridge alignment and geometry
  • 6.2 Atlantic vs Indian vs Pacific
  • 6.3 90° relationships
  • 6.4 Iceland as a ridge–roll interface
  • 6.5 Implications for seafloor spreading

Chapter 7 — Subduction Zones and the Ring of Fire

  • 7.1 Convergent boundaries as part of the same system
  • 7.2 The Pacific framework
  • 7.3 Mirror symmetry (Japan–New Zealand)
  • 7.4 Andes, Kamchatka, Cascades
  • 7.5 Polygonal structure of volcanic arcs

III — PHYSICS OF THE SYSTEM


Chapter 8 — Convection Physics

  • 8.1 Rayleigh-Bénard convection
  • 8.2 Threshold conditions
  • 8.3 Roll formation and stability
  • 8.4 Laboratory analogues
  • 8.5 Scaling to Earth

Chapter 9 — Rotation and Geometry

  • 9.1 Earth’s rotation and flow alignment
  • 9.2 Coriolis effects
  • 9.3 Spherical geometry constraints
  • 9.4 Energy distribution with depth
  • 9.5 Directional deformation

Chapter 10 — Energy Flow in the Earth

  • 10.1 Heat sources in the Earth
  • 10.2 Radiogenic heat vs primordial heat
  • 10.3 Core–mantle interaction
  • 10.4 Adiabatic gradients
  • 10.5 Energy balance of the system

Chapter 11 — The Core Revisited

  • 11.1 Inner vs outer core
  • 11.2 Problems with crystallization models
  • 11.3 Thermal equilibrium constraints
  • 11.4 Stability of core–mantle boundary
  • 11.5 Alternative energy pathways

IV — SURFACE EXPRESSIONS


Chapter 12 — Iceland as a Natural Laboratory

  • 12.1 Volcanic zones of Iceland
  • 12.2 Reykjanes
  • 12.3 North and East volcanic zones
  • 12.4 Rift shifts and jumps
  • 12.5 Earthquakes and dyke propagation

Chapter 13 — Global Case Studies

  • 13.1 The Great Rift Valley
  • 13.2 Afar Triangle
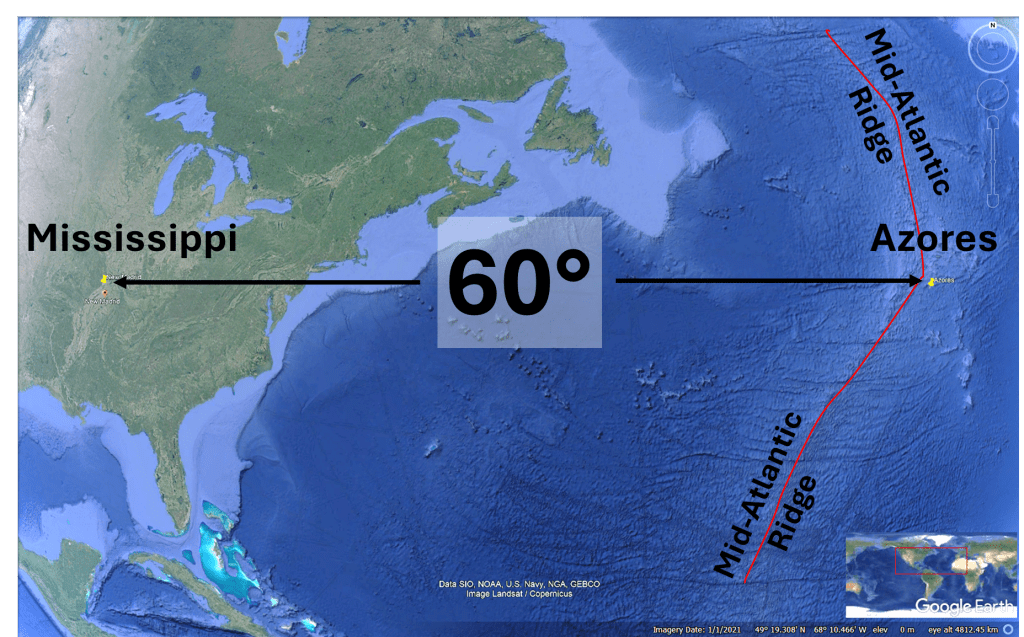
  • 13.3 Mississippi & global symmetry
  • 13.4 Yunnan rivers
  • 13.5 Mid-ocean ridge systems

Chapter 14 — Volcanic Systems

  • 14.1 Geometry of eruptions
  • 14.2 Icelandic eruptions (Laki, Eldgjá)
  • 14.3 Fagradalsfjall system
  • 14.4 Surtsey and oceanic volcanism
  • 14.5 Global comparisons

Chapter 15 — Geothermal Systems

  • 15.1 Heat distribution
  • 15.2 Vapour reservoirs (Geysir)
  • 15.3 Predicting geothermal locations
  • 15.4 Applications for energy
  • 15.5 Case studies

V — GLOBAL GEOMETRY AND PATTERNS


Chapter 16 — The Geometry of the Earth System

  • 16.1 Polygons and segmentation
  • 16.2 Global symmetry
  • 16.3 Circular vs linear interpretations
  • 16.4 Equatorial structure
  • 16.5 Global mapping

Chapter 17 — Plate Motion Reinterpreted

  • 17.1 Drift as a consequence, not a cause
  • 17.2 Relation to convection rolls
  • 17.3 Symmetry of plate movement
  • 17.4 Transform faults revisited
  • 17.5 San Andreas in context

Chapter 18 — The Ring of Fire Revisited

  • 18.1 Full system perspective
  • 18.2 Energy flow
  • 18.3 Structural consistency
  • 18.4 Predictive implications
  • 18.5 Future research directions

VI — IMPLICATIONS AND FUTURE WORK


Chapter 19 — Predictive Geoscience

  • 19.1 Predicting volcanic zones
  • 19.2 Predicting geothermal resources
  • 19.3 Mapping unknown structures
  • 19.4 Risk assessment

Chapter 20 — Testing the Model

  • 20.1 What must be measured
  • 20.2 Seismic validation
  • 20.3 Laboratory analogues
  • 20.4 Numerical simulations
  • 20.5 Falsifiability

Chapter 21 — A New Framework for Earth Science

  • 21.1 From description to structure
  • 21.2 Implications for geology
  • 21.3 Implications for energy
  • 21.4 Open questions
  • 21.5 Final synthesis
Uncategorized

The Mississippi River, Oceanic Ridges, and the Geometry of Mantle Convection Rolls

Mathematics of Mississippi River

One of the recurring observations in the mantle convection rolls model is that major surface features, both continental and oceanic, are not randomly distributed. Instead, they appear to follow large-scale geometric divisions of mantle convection rolls.

A compelling continental example is the Mississippi River system, as shown below:

The thick lines, one of which closely follows Mississippi, represent the large-scale lower mantle convection rolls as shown here:

The Mississippi River representing a Mantle Division Line

The Mississippi River follows a remarkably linear north–south corridor that coincides with deep tectonic segmentation of the North American lithosphere. Along this corridor lies the New Madrid Seismic Zone, one of the most significant intraplate seismic regions in North America.

In the conventional framework, intraplate earthquakes are often treated as localized structural reactivations. However, when viewed through the mantle convection rolls model, the Mississippi corridor may represent a lithospheric expression of a deeper mantle division line. The seismicity is then not anomalous, but a surface response to organized mantle flow beneath the continent.

This interpretation gains strength when examined geometrically.

At latitude 37°N, two reference points illustrate a striking longitudinal spacing:

  • 37° 0.000’N, 90° 0.000’W — Mississippi River region
  • 37° 0.000’N, 30° 0.000’W — Mid-ocean ridge near the Azores Triple Junction

The second point lies along the Mid-Atlantic Ridge, 60° of longitude east of the Mississippi reference. This spacing is consistent with the calculated division intervals derived from large-scale convection roll geometry.

The Mississippi River corridor and the Mid-Atlantic Ridge segment near the Azores thus occupy corresponding positions within the roll framework, one expressed in continental lithosphere, the other in active oceanic spreading.

Extending the Pattern: Juan de Fuca and Reykjanes

The pattern does not stop there, as two additional ridge systems , the Juan de Fuca Ridge and the Reykjanes Ridge, are also located along mathematically calculated mantle convection roll division lines.

These two ridges show notable geometric consistency with one another:

The Reykjanes Ridge forms the northern extension of the Mid-Atlantic spreading system toward Iceland, while the Juan de Fuca Ridge represents an active spreading center in the northeast Pacific. Despite their geographic separation, their placement within the roll division geometry suggests they are not isolated features but components of a larger, organized mantle system, exactly 90° apart from each other.

A Unified Interpretation

When these features are considered together, a coherent spatial pattern emerges:

  • The Mississippi River tectonic corridor
  • The New Madrid Seismic Zone
  • The Mid-Atlantic Ridge near the Azores Triple Junction
  • The Reykjanes Ridge
  • The Juan de Fuca Ridge

All align within a consistent framework of mathematically derived mantle convection roll divisions.

This alignment suggests that:

  1. mantle convection rolls structures exert a primary control on lithospheric segmentation.
  2. Oceanic spreading centers and continental intraplate seismic zones may represent different surface expressions of the same deep mantle flow boundaries.
  3. Intraplate activity along the Mississippi is not an exception to plate tectonics, but a predictable outcome of organized mantle roll geometry.

Rather than viewing mid-ocean ridges, triple junctions, and intraplate seismic zones as separate tectonic phenomena, the convection roll model places them within a unified dynamic system.

Implications

If these correlations are structural rather than coincidental, they imply that mantle convection rolls operate at a scale capable of organizing both continental drainage corridors and oceanic spreading centers.

The Mississippi River, often treated purely as a surface hydrological feature, may therefore trace a deep mantle boundary. The Azores Triple Junction and associated Mid-Atlantic spreading segment may represent the oceanic counterpart of the same geometric division. The Juan de Fuca and Reykjanes ridges further reinforce the repeating pattern.

In this framework, Earth’s surface geometry reflects a deeper, mathematically structured mantle circulation, one that integrates ridges, faults, triple junctions, and intraplate seismicity into a single coherent system.

The accumulating consistency among these examples adds to the growing collection of geological features adhering to the mantle convection rolls model.

Uncategorized

The circular tectonic drift vectors of Anatolia

The tectonic drift of the Anatolian Plate is notably independent from its surroundings. While the Arabian Plate moves northward, similar to the African Plate, the Anatolian Plate exhibits a counterclockwise rotation. This motion can be examined through the lens of the convection rolls model to see whether it offers any additional insights. The outcome is striking and reveals two key points:

  1. The combined structure of convection rolls and plate boundaries appears to create the conditions for a central pivot point around which the Anatolian Plate rotates.
  2. If a fixed point within the convection model exerts a dominant influence on tectonic drift, then the convection rolls also offer a framework for understanding the subduction of the African Plate beneath the Eurasian Plate.

The map showing drift vectors can be found at:
https://www.tandfonline.com/doi/full/10.1080/19475705.2024.2446588#abstract

The most significant observation is that this central pivot lies near the 32nd parallel, precisely where two mantle upwelling lines intersect at approximately 32.1°E. Along this latitude, the convection roll system is aligned exactly north–south, making it a key structural feature, comparable in importance to the equator and the 64°N/S parallels. Interestingly, this location corresponds roughly to the eastern edge of the Nile River delta. It has previously been noted that the deltas of the world’s largest rivers—especially the Amazon at the equator—are situated at critical junctions within the convection rolls framework. https://magicmagma.com/2022/10/04/what-do-the-three-famous-rivers-amazon-nile-and-mississippi-have-in-common/

Given this fixed relationship between surface tectonics and mantle convection geometry, the concept of rollback requires reconsideration. In this case, the European continent appears to be drifting away from the latitude at which the African Plate subducts beneath it. Whether we interpret this as northward retreat of the African slab or northeastward drift of Europe, the geological consequences are functionally the same.

The side-view depiction of African Plate subduction shows how numerous geological features have developed over the last 35 million years, since subduction began. These reflect the continuing northeastward movement of the Eurasian Plate, while the northern edge of the African Plate descends beneath it.

This is from https://www.youtube.com/watch?v=cqK-CbuM3Eo

Just to clarify a bit what drives the tectonic drift anomaly of Anatolia, a particular bit of convection roll can be pointed out:

It can also be pointed out that most geothermal activity is found in this part of Turkey. Take a look at this map:

It is from https://www.researchgate.net/figure/Geothermal-map-of-Turkey-MTA-2021b_fig1_365230456

The red area in Western Turkey coincides with the convection roll taking part in driving the rotation of the local tectonic plate. This can explain the geothermal activity anomaly.

Note that the appearence of the aggregate of vectors of GPS drift measurements of the Anatolian Peninsula is not only circular, but also basicly from east to west. The mathematical precision of the drift can only be possible because of a very regular system of convection rolls underneath. The rolls following the drift are coupled to the layers above, the ones opposing are decoupled. Thereby the engine driving this interesting rotational drift of the plate can be explained thoroughly.

Just to clarify further how the convection rolls move the tectonic plate, this drawing is added:

The red areas provide force for the circle to move anti-clockwise in an almost circular way. As previously mentioned, the pivotal point is also a key point within the convection rolls system as a whole, due to the exact N-S alignment of convection rolls at the 32nd latitude.

Uncategorized

Why Convection Rolls of the Mantle Form a Regular Pattern

Convection rolls within the mantle have an adiabatic heat gradient, starting at the border between tectonic plate bottom and the layer below. Logically, the mantle must therefore as a whole be on the verge of being ductile and stagnant. A tectonic plate is 120 km thick, according to the defination that its lowermost border is where convection, or constant flow of mantle material, is found.

It has been found in laboratories, that if mantle material at this point (convecting but very close to becoming stagnant) does form convection rolls. As reality and experimental results are to be compared, especially if no other factors affecting real circumstances than used during experiment can be pointed out, inserting the outcome of experiment into known and measured circumstances is indeed a piece of work any scientist should undertake.

In this case it is easy, because the thickness of inner layers of Earth are known. Putting togherher the outcome of the experiments in laboratories, the logic of adiabadic thermal gradient, and knowledge about the depth of each layer, this is the outcome:

This is the basic picture of a section of convection rolls within the Earth. Inserting the results of experiments, fits exactly into measured environment.

Most people recognize the core, mantle and crust, and some might notice the Gutenberg layer, also known as the core-mantle boundary or CMB. This is a beginning of a study described in the book found here on this webpage. Reading that book is of course more difficult than reading this short post, and most people do certainly not have time enough to read it. It can be said here, though, that all the implications have been worked out, and how the convection rolls form a 3D system within the Earth is thereby fully understood. In turn, it enhances our overall understanding of geology.

Uncategorized

The Convection Rolls Model – How is it Derived?

The Convection Rolls Model has been used to explain a myriad of geological features. The starting point is easy to derive, because the layers of Earth have a regular pattern, and Rayleigh-Bénard type of convection rolls fit precisely into it.

Layers of Earth and Rayleigh-Bénard convection rolls inserted.

The convection rolls are affected by the rotation of the Earth, and the same proportions prevail farther north and south within the rotational plane. The height and width of the mantle convection rolls therefore adhere to the physics of Rayleigh-Bénard convection all over the globe.

Therefore, it was possible to derive the comprehensive or global convection rolls model, starting from the obvious match within the equatorial plane.

The match shown above is mathematical, to show that the intersection zones are really intersections between main layers. At equator, the convection rolls tend to be arranged directly above each other.

This drawing shows how the convection rolls are arranged directly above each other. It also shows secondary convection rolls within the lower mantle. The Lehmann layer of the core is omitted here. The system can then be traced northwards and southwards, and the global system derived, which is described here.