I am a geologist, graduated from the University of Iceland, and taught geology for a few years. I have gained some knowledge about Earth's inner structure, so I provide this website as my contribution to answer one of the greatest questions remaining within the realm of geoscience. Experiments show that the mantle should form convection rolls when close to the melting point. I took this literally, and calculated the dimensions and shape of these mantle convection rolls. Then I compare that model with the surface. This makes it possible to provide many interesting examples about geology found on my blog.
The Cumbre Vieja volcanic eruption on La Palma is a reason for looking into the system of convection rolls according to the relevant model underneath the Canary Islands. Mainly four convection rolls, and thereby four division lines are responsible for the activity of this chain of volcanic islands.
The convection rolls below the Canary Islands.
Narrow red lines show upwelling, black lines show downwelling. The lines oriented NNW show division between uppermost convection rolls at 120 km depth, directly affecting the tectonic plate’s ductile part. Because the tectonic drift carries the islands eastwards, the youngest islands are the westernmost ones. The islands appear at first close to division line between rolls 1 and 2, and go through a stage of building up a shield volcano. The activity diminshes within the realms of convection roll 3. Rejuvinated volcanism does, according to this model, occur due to the fact that the islands drift from one convection roll to the other. Relatively recent eruptions have occurred above convection roll 4.
A simple 3D model can be made to understand better the arrangement of mantle currents under Iceland. It has three 2D components, surface, E-W vertical section along 64°N and N-S vertical section along 21°10’W. It looks like this:
Convection rolls arrangement model.
The easy part to understand is the E-W arrangement, as the convection rolls of asthenosphere are always 1.5° wide along each latitude. The latitude chosen here is 64°N, so when you follow it you will always meet with intersection between rolls at the interval corresponding to 1.5° of longitude. This can be comprehended rater easily, and it is clearly drawn above.
A more difficult part is the N-S section, showing the sides of the convection rolls. There are two rolls found in between 120 and 410 km, usually, but here two systems intersect each other, so the rolls become 4! our mind is not trained for this, so we become tired when confronted with this puzzle. Still, this is very simple compared with the most complex things most of us need to learn one day or another.
The surface part might be most difficult, because the different lines separating the individual pairs of convection rolls are drawn there, showing a pattern of all four layers. It is very easy to imagine a line between two convection rolls, but many convection rolls side by side are more difficult, and four different layers add considerably to the complexity.
Therefore, this simple model, based on the fact that hot material rises up, flowing to the sides while cooling, then sinking and being heated again, becomes too complicated for us to understand without a considerable effort of study.
You can make this model by printing the picture, then cutting out the three parts separately and combine the dotted lines of the vertical parts, gluing with surface at the crossings of 64°N and 21°10’W.
You see why 64°N is chosen as E-W section. It is the only latitude where all the upper rolls have the same dimension and are regularly arranged. If you understand the model, you might be able to make similar sections at other latitudes.
With GPS technology, we finally could measure tectonic drift quite accurately. Iceland is divided into two parts, and it is manifested with direct measurement. The points measured have been fixed, the satellites give signals to relevant equipment. After measuring the points twice, the vector of displacement appears clearly. This is the result:
Both reports make it clear that these vectors are the results of measurement. All other vectors are found by changing their directions and length according to a formula. Therefore, we should adhere as much as possible to this original result of measuring the tectonic drift, to remain closer to the truth, being able to know about reality, and be aware of the facts we should base our understanding of the world on.
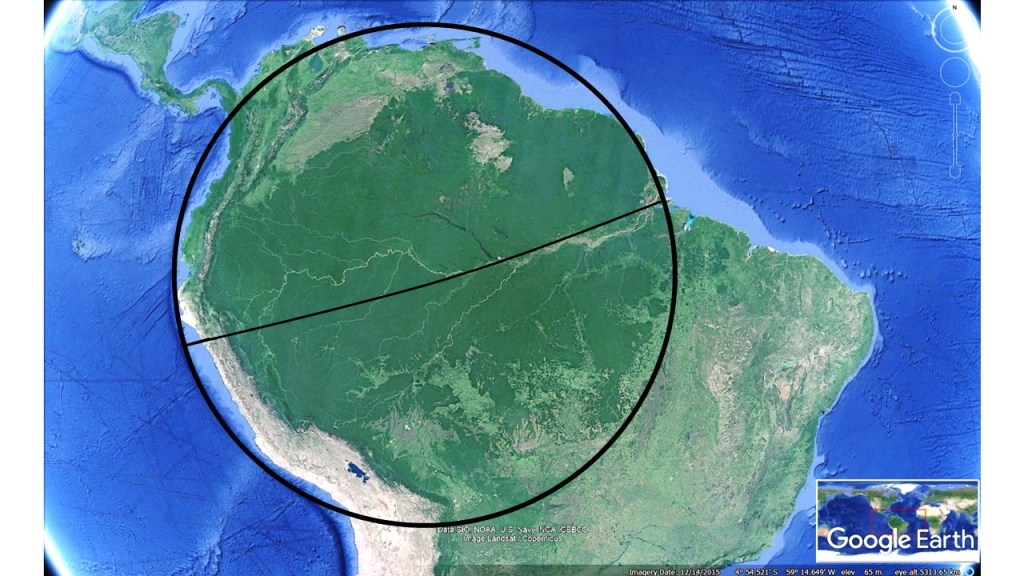
The pattern of land distribution along equador is one of the characteristics making our globe beautiful seen from space. Pointing the regularity out makes us think as well as feel. This circle spanning 30° along along 0° of latitude tells a story. A string is drawn through the circle, showing how the Amazon area is approximately aligned.
The circle of Amazon.
The forces of tectonic drift have been affecting South America quite strongly. According to the model of convection rolls, the Amazon estuary is located at a divisional line/point of downwelling between two large scale convection rolls of lower mantle. The span of the continent is exactly 30° along equator from coast to coast. This provides some constrains on the tectonic drift, causing South America to rotate. This circle represents one aspect of these present movements.
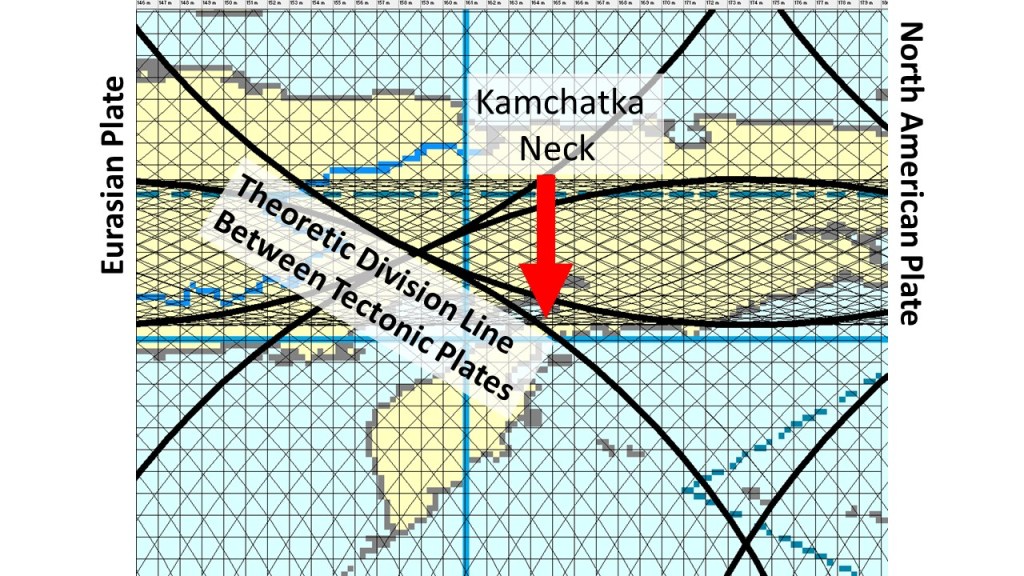
The Aleutean Islands form an arc as the Pacific Plate drifts underneath the North American Plate. It is tempting to study a bit closer, because it seems like a semi-circle with a string from east to west. Let us follow the islands, connecting them with a line, and see what we get:
The area of Kamchatka is geologically extremely important, becauase in those areas the North American Tectonic Plate meets the Eaurasian Plate. A main division line of the model used here does cross the peninsulas there.