Physics
Here, a geometrically constrained, physics-motivated model for the large-scale convection architecture of Earth’s interior, is developed. The central objective is to show that the apparent complexity of surface geology can be understood as the surface expression of a comparatively regular interior system—one that is (i) consistent with the known physical behavior of convective flow and (ii) strictly constrained by geophysical measurements of Earth’s layered structure.
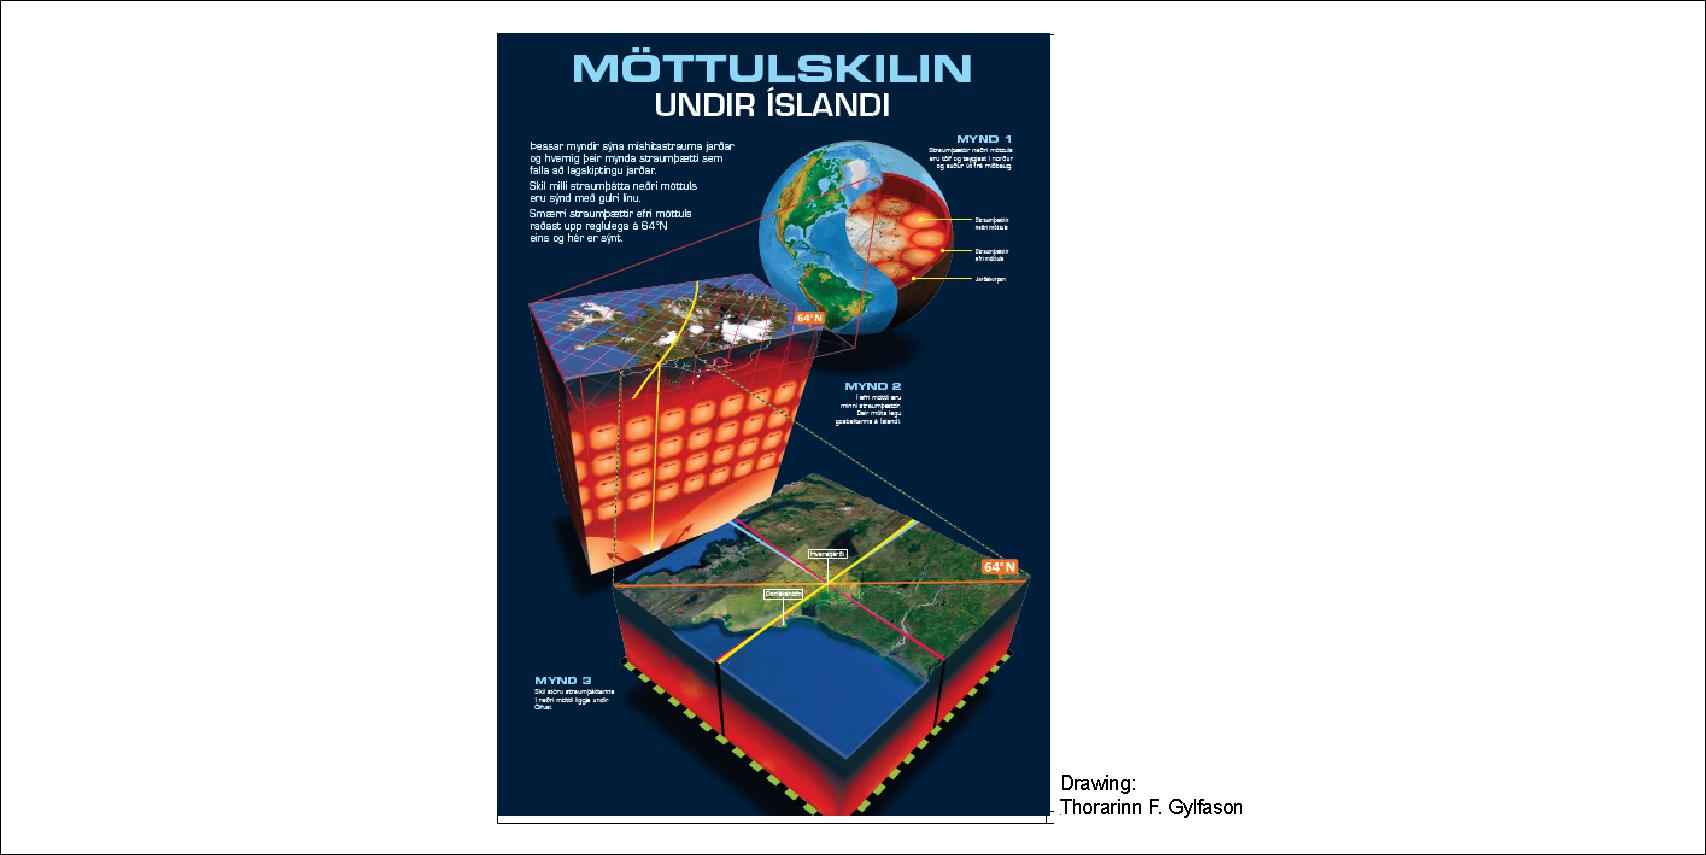
The method is intentionally bottom-up. It begins with measured layer thicknesses and a small number of physical principles, imposes a strict geometric requirement on how convection must occupy those layers, derives a three-dimensional convection-cell architecture, and only then (in Part II) compares the resulting predictions with surface observations such as fault systems, mid-ocean ridges, volcanic zones, and geothermal provinces. Iceland serves as a particularly powerful natural laboratory because multiple parts of the system intersect there.
A chain of implications:
- Layering → Geometry
Earth’s measured internal stratification defines fixed radial spaces that convection must occupy. - Physics → Cell proportions
Rayleigh–Bénard convection under balanced conditions favors rolls with comparable vertical and horizontal dimensions. - Exact filling → Discrete structure
When layers are required to be filled exactly by RB roll sections, characteristic cell sizes and integer counts emerge. - Rotation → Curvature
Earth’s rotation constrains the horizontal planform of flow, producing systematic curvature and latitudinal organization. - Continuity → Intersection zones
Global circulation requires geometrically defined zones where different roll families and layers connect smoothly. - Petrology → Two-layer interpretation
The resulting upper-mantle structure naturally accommodates two chemically distinct source regions, consistent with MORB and OIB. - Heat transport → Focused pathways
Convection, conduction, radiation, and focused melt transport together explain how a regular interior system can produce localized surface volcanism.
The guiding premise throughout Part I is that regularity is the default expectation for a slowly evolving, rotating convective system operating over geological timescales inside a nearly spherical body.
Background
When Earth’s internal layers—defined seismologically—are drawn to scale, their thicknesses exhibit a degree of regularity that invites geometric testing. The working hypothesis is that this regularity is not accidental: convection within the Earth organizes itself in a way that fills the available radial space efficiently and repeatedly.
The model does not introduce new physics. Instead, it organizes existing measurements within a coherent geometric and physical framework, extending classical ideas about mantle convection and plate motion in the conceptual tradition of Sir Arthur Holmes and Harry Hess, besides Alfred Wegener and others. The novelty lies in enforcing internal consistency across all layers simultaneously.
The governing preconditions are deliberately minimal:
- Thermal forcing: sustained heat flow requiring convection in the mantle and outer core.
- Rotation: Earth’s spin, introducing Coriolis constraints on horizontal flow.
- Measured stratification: seismically determined depths of major boundaries and transition zones.
If convection has operated for billions of years in a thick, relatively homogeneous mantle, logic suggests that the system approaches a balanced, quasi-steady organization. Under such conditions, repetitive structures are expected rather than arbitrary ones.
Radial geometry and the primary constraint
The central requirement of the model is simple and strict:
Each convecting layer must be exactly filled by sections of Rayleigh–Bénard convection rolls, without adjustment of dimensions.
The roll geometry is determined solely by this requirement and by the physical tendency of RB convection toward comparable vertical and horizontal length scales.
No internal length scale is assumed in advance. Instead, the measured thicknesses of the layers define the available space, and the roll dimensions must adapt to that space under the constraint of exact geometric filling. The geometry then follows the rotational plane of the Earth, starting with the equatorial plane where convection flow and centrifugal force coincide in one plane.
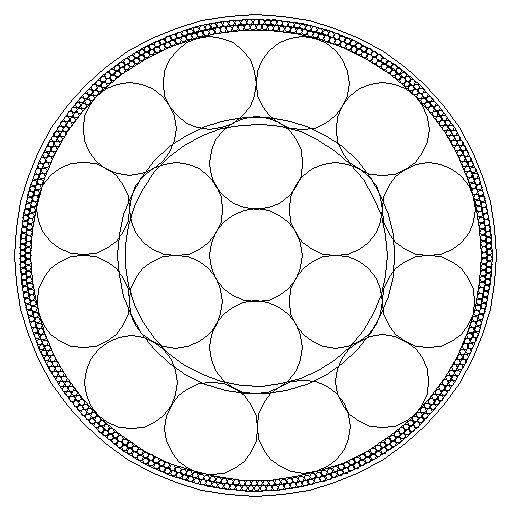
To make the geometry explicit, the conventional “surface-down” description of Earth’s structure is reformulated as a center-out radial system. This allows roll sections to be constructed directly within each layer. When this is done, a regular packing of roll sections emerges that simultaneously satisfies multiple layer boundaries, including the core–mantle boundary region and the upper mantle transition near ~410 km.
The key point is logical rather than numerical:
when a single roll geometry fits several independent, measured layers without tuning, the probability of coincidence becomes small. The consistency itself becomes the result.
Upper mantle structure and the 410 km and 670 km discontinuities
Attention then shifts to the part of the Earth most directly coupled to surface geology: the upper mantle and asthenosphere.
Two boundaries define the active convective domain beneath tectonic plates:
- an upper boundary near ~120 km, where behavior shifts from conduction-dominated lithosphere to convection-dominated asthenosphere;
- a lower boundary near ~410 km, marking the top of the large lower-mantle convection system in this framework.
This creates approximately 290 km of vertical space. When exact RB roll filling is imposed on this interval, simple trigonometry shows that only certain discrete arrangements are possible. A particularly robust solution yields 240 convection cells around the globe in the upper layers, corresponding to a longitudinal spacing of 1.5°.
This number is not arbitrary. It is constrained by symmetry, by divisibility relative to the deeper system, and by the requirement that upper and lower systems nest coherently. The result is a hierarchical structure: large rolls below and smaller rolls above.
The interval between ~410 km and ~670 km is found to accommodate additional roll systems, also with a longitudinal spacing of 1.5°, nested within the larger cells. These secondary systems do not replace the primary structure but supplement it, allowing vertical and horizontal circulation to remain continuous.
Horizontal geometry, rotation, and curvature
With the vertical structure established, the model turns to horizontal geometry. In a rotating system, convection cannot remain rectilinear. The Coriolis effect causes flow paths to curve in systematic ways.
Using inertial-flow reasoning, the characteristic horizontal scale of unconstrained motion on a rotating Earth is of the order of Earth’s radius. To represent this geometry, a square latitude–longitude grid is used as a drawing space, with the understanding that it is a mathematical convenience rather than a physical projection.
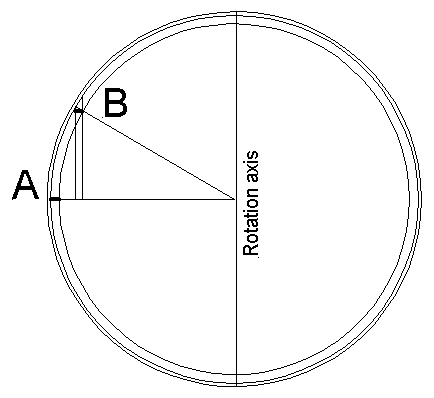
Imposing two constraints—
- fixed separation of roll boundaries at the equator, and
- latitude-dependent horizontal scaling proportional to 1 / cos φ—
leads to a compact geometric condition whose solution identifies a characteristic latitude near 32° N and S. Circles centered near these latitudes reproduce the required horizontal dimensions while remaining consistent with rotational physics.
Earth is not a perfect sphere, but a geoid. Because curvature deviations are not uniformly distributed with latitude, the operational center is taken as approximately 32.0°, which is makes geological-scale predictions possible.
The resulting map-level representation consists of families of circular roll boundaries spaced at 1.5° intervals, supplemented by polar roll families that connect smoothly to the hemispheric system.
Importantly, the circle equations themselves are dimensionless. Angular degrees enter only when the geometry is interpreted on Earth’s surface.
MORB and OIB as expressions of a two-layer system
The geometric framework naturally accommodates a petrological distinction long recognized at the surface: MORB versus OIB.
In the model, these correspond to two vertically stacked convection layers within the upper mantle. The upper layer supplies MORB to mid-ocean ridges, while the lower layer samples deeper or compositionally distinct material consistent with OIB.
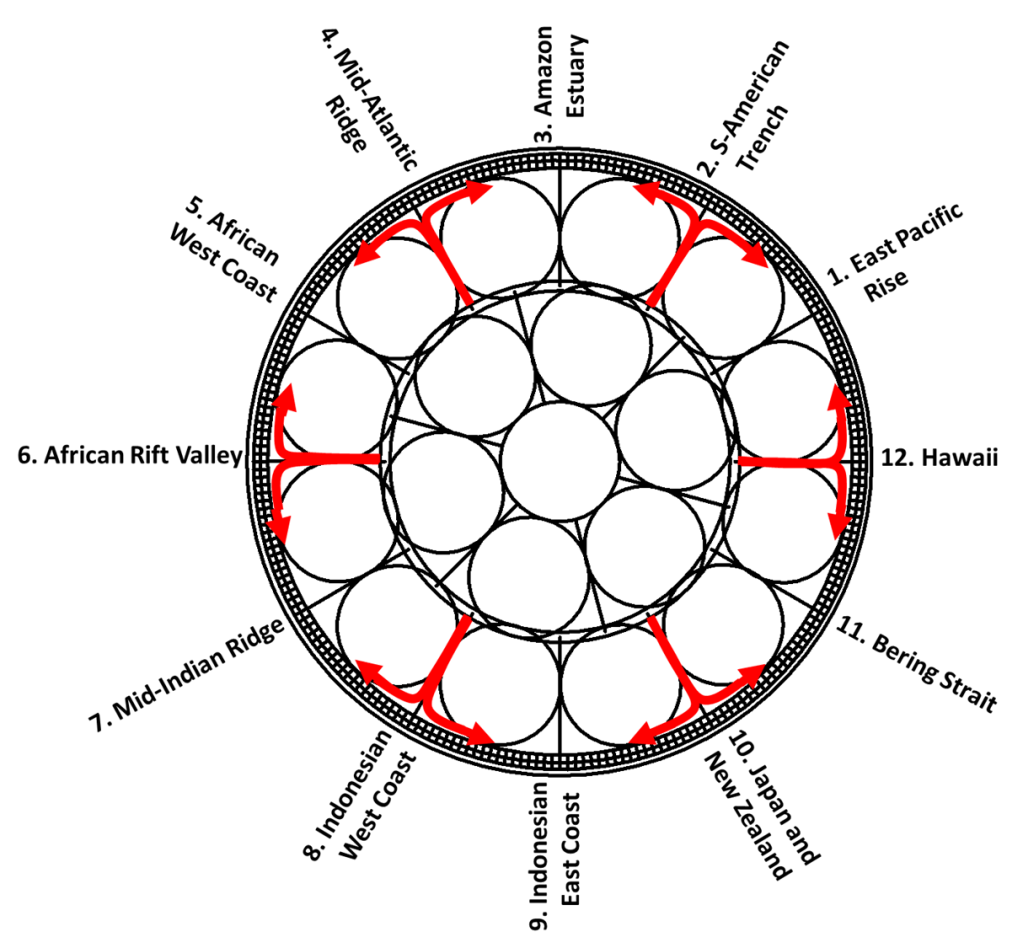
Horizontal circulation is described as linked semicircular segments: material travels along a semicircle in one layer and returns along a complementary semicircle in the other, forming a closed loop. This architecture allows continuous circulation while limiting mixing—precisely what is required if MORB and OIB remain distinct over geological time.
When the derived circle families are plotted on a world map, individual boundaries often align with major geological structures. These alignments are not assumed in advance; they become testable predictions.
Heat transfer, radiation, and focused pathways
While convection is the dominant mode of heat transport, conduction and radiation also play roles. At high temperatures, mantle materials may become increasingly transparent to thermal radiation, effectively enhancing internal heat redistribution.
In this framework, radiative transfer allows heat generated in upper layers—where radioactive elements are concentrated—to contribute to deeper thermal budgets, with convection redistributing that energy upward again.
At the boundaries between convection cells, focused upward melt transport is proposed to occur via Munroe-type effects, where geometric and thermal focusing produce narrow, persistent conduits. These conduits provide a mechanism by which a broadly regular convection system can generate sharply localized volcanism and geothermal anomalies.
Intersection zones and global continuity
A global circulation system must close smoothly. This requires intersection zones where different roll families and layers connect without violating rotational constraints.
Two principal types are identified:
- Mid-to-high latitude intersections (~60.7°–67.3°), where hemispheric and polar roll systems meet. Near ~64°, roll directions become tangent, allowing exchange without disrupting curvature.
- The equator, where the Coriolis effect changes sign. Here, flow must reverse curvature or transfer between layers, imposing strong geometric constraints that may explain large-scale equatorial regularities.
In these zones, effective layer doubling or reorganization may occur, producing greater structural complexity. Iceland lies within such an intersection region, explaining its unusually rich geological expression.
Integrated logic
The model proceeds as a single logical construction:
- measured stratification defines the available space,
- RB convection physics constrains roll proportions,
- exact geometric filling produces discrete, nested structures,
- rotation shapes horizontal curvature,
- intersection zones ensure continuity,
- petrology provides independent confirmation,
- and extended heat-transfer mechanisms explain focused surface activity.
The outcome is a coherent, testable three-dimensional framework. It produces explicit geometric predictions—locations, orientations, and characteristic spacings—that can be confronted directly with geological and geophysical observations.