Uncategorized

Iceland compared with the Antarctic Peninsula

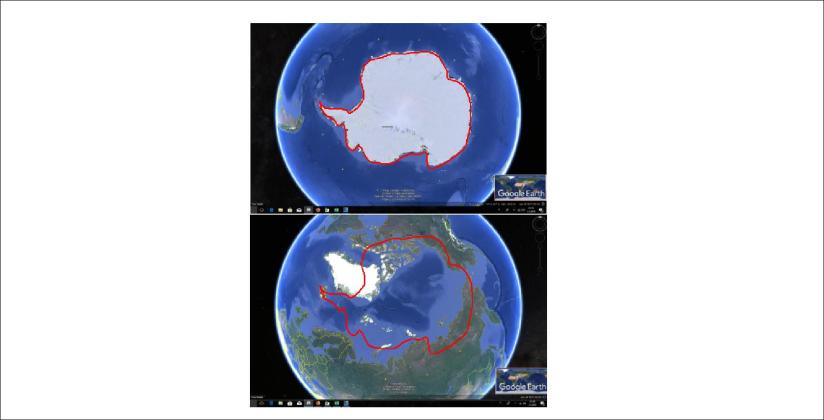
We are so lucky that we have land in the southern hemisphere at the same latitude as Iceland. It is known as the Antarctic Peninsula. We can compare the two areas quickly:

Iceland and Antartic Peninsula compared

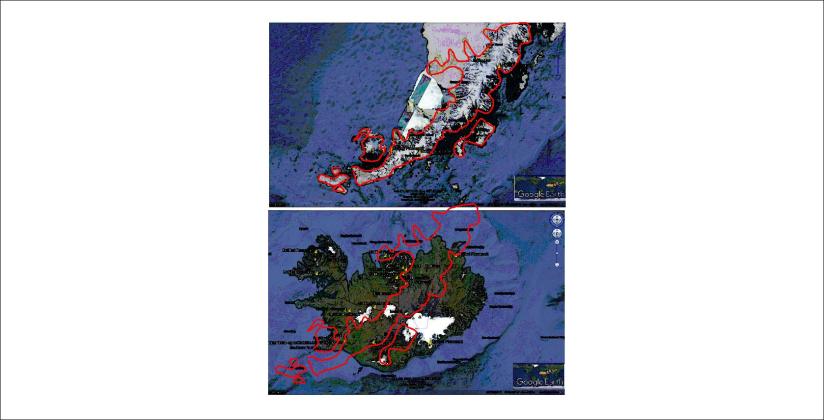
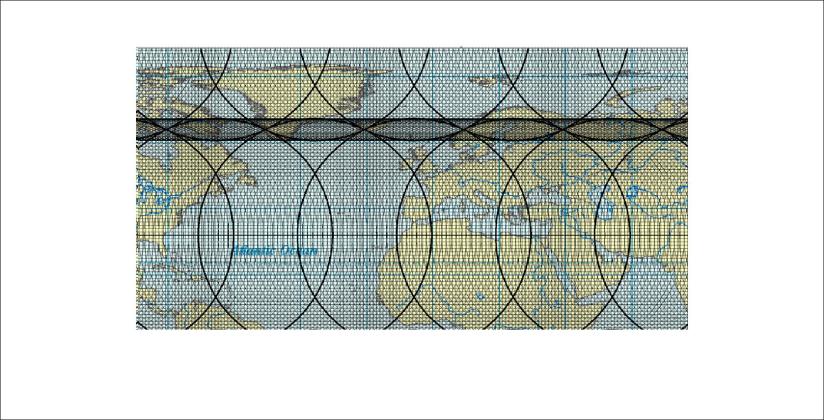
By adding the outlines of the Antarctic Peninsula over Iceland according to similar positions according to the convection rolls, the coast of the peninsula follows the same trend as the main division line of the Atlantic Ocean as it can be traced over Iceland.

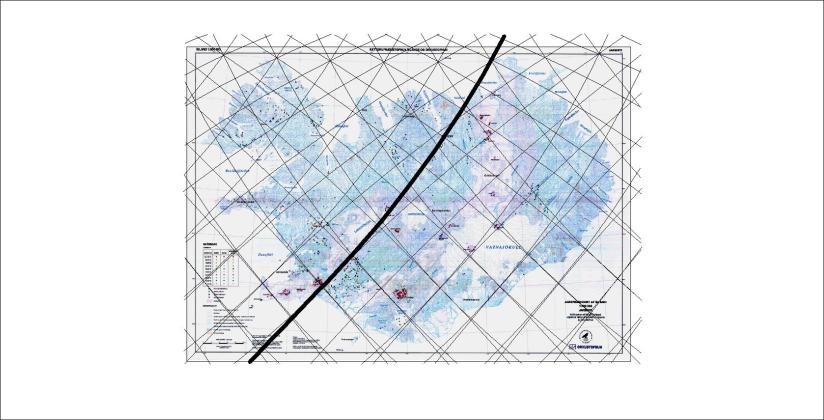
It looks like this on the map base of Náttúrufræðistofnun and Orkustofnun:

Iceland division line

The accuracy is quite striking, but again we have to have in mind that the same kind of forces underneath shape the surface. You do not have to look twice:

Iceland division line with Antarctica division line

The comparison is not only made according to latitudes, but general layout of Antarctica compared with the Arctic Ocean. For curious people the drawing on the Google map is shown here:

Skautin borin saman - 01

What was that? Now we can start speculating!


Uncategorized

Faxi – the surprise waterfall of the Golden Circle of Southern Iceland

Faxi
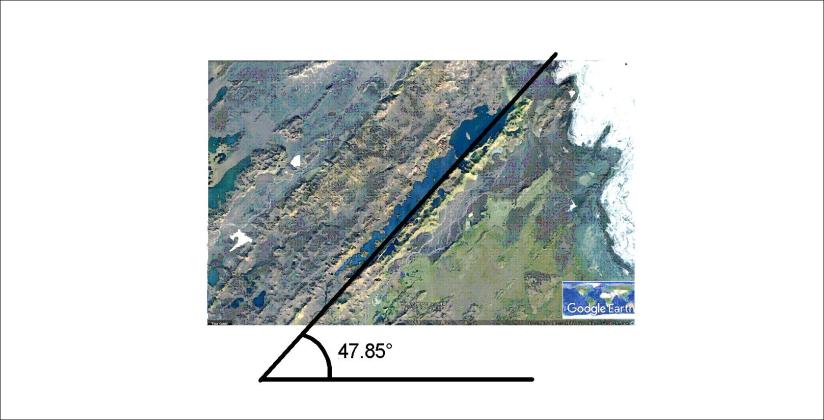
Faxi is not far from Gullfoss and Geysir and has been seen by many on the so called Golden Circle Tour. Again, the alignment of the waterfall is a curiosity. The river Tungufljót makes a turn and forms a waterfall over the cliffs almost in the opposite direction of the river. This feature can be calculated, as the cliffs follow the orientation of convection rolls. This is best shown with a Google map and the relevant drawing and formula:

Faxi - 02

The direction is N42°E, as the drawing shows E48°N according to the direct result of calculation (with ϕ=64.22).

This could be a coincidence, but many identical results makes it less likely. Just compare this with a former post about Dettifoss (with ϕ=65.80):

Dettifoss og Faxi - 01

The same formula applied at these different latitudes marks the alignment of both waterfalls!


Uncategorized

Hraunfossar – one of Iceland’s most outstanding waterfalls

Hraunfossar
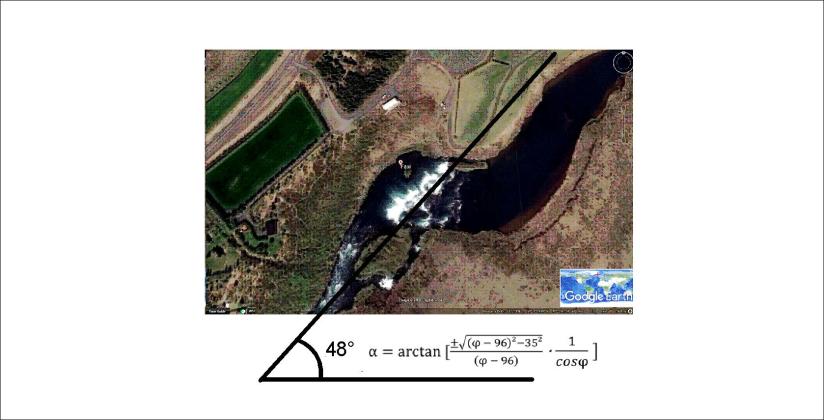
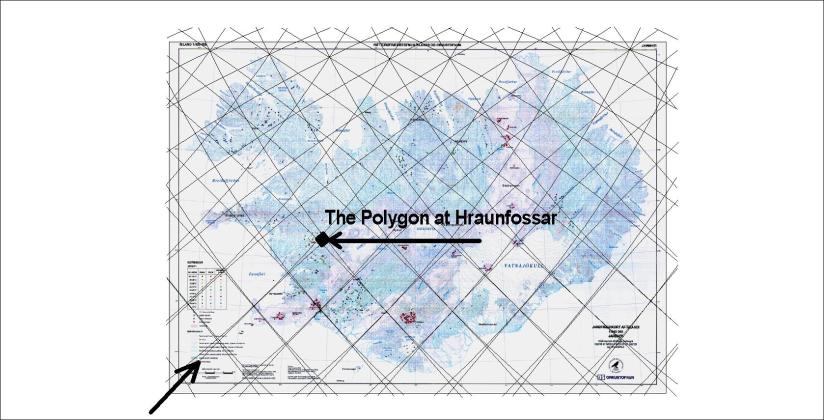
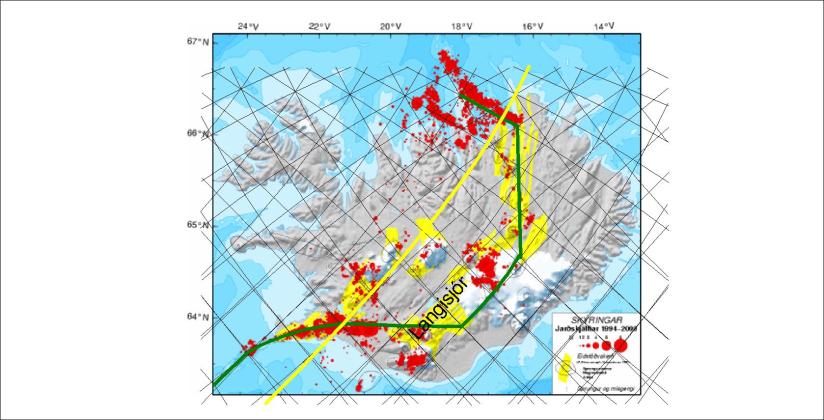
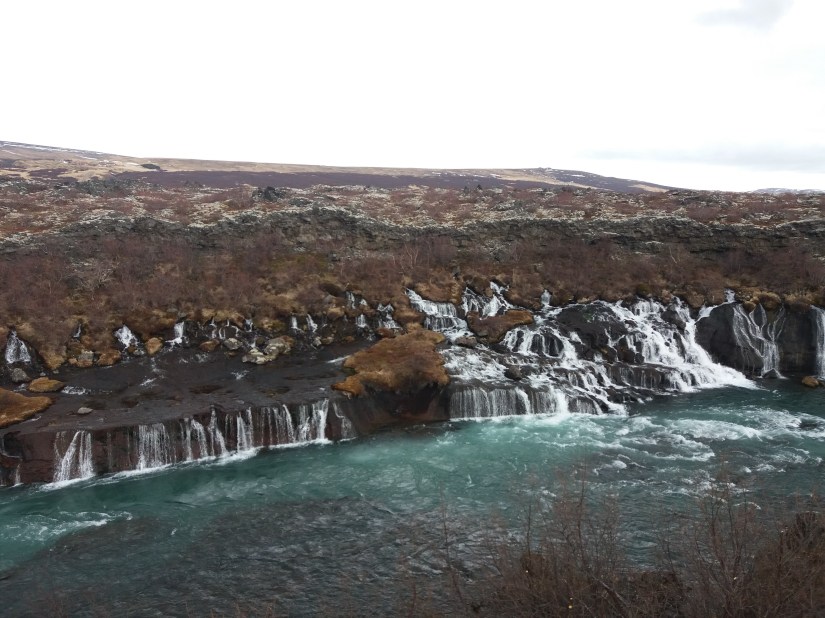
Hraunfossar – the waterfall of no river above it! The beauty and special settings of Hraunfossar can be partly explained. First we have to have in mind its position compared to the convection cell grid, as shown here on the base of a map from Náttúrufræðistofnun and Orkustofnun:

Hraunfossar og Barnafoss - 03

Let us zoom in on this polygon. According to the Convection Cell Model, the upwelling division line creating the Reykjanes Ridge is just at the side of the Hraunfossar waterfall. It can be seen on this Google map:

Hraunfossar og Barnafoss - 01

The small polygon, formed by near-crossing of four division lines between convection rolls, is subject to very clear EW-oriented tectonic settings due to the symmetry of the polygon. The river Hvítá flows accurately along the tectonic EW-axis, leading Hraunfossar to fall southwards into it. Let us now look even closer to realize what this waterfall is all about:

Hraunfossar og Barnafoss - 02

The lava, under which the water flows until it appears in the Hraunfossar waterfall, is considered to have flown in the 10th century. It is called Hallmundarhraun and has partly flown along a valley aligned exactly as the mantle convection line. The direction is E43.8°N. But that is not the ruling direction. A one step analysis of horizontal balance between EW-axis and the convection roll line shows the main outlines of the surrounding landscape. It is marked as a/2 and is aligned E21.9°N. The lava flow has been directed further along the E21.9°N topography alignment as it spread out along the valley of tectonic EW-axis, finally providing this excellent waterfall at the western most end of the lava.

Uncategorized

The tectonic alignment of Yellowstone calculated in the same way as for volcanoes in Iceland

The Yellowstone area can be studied with a simple formula:

Yellowstone - 01

Many volcanic sites in Iceland can be calculated in the same way. For instance Hekla is aligned according the same formula as shown below.

Hekla - Trondheim - 01

In exactly the same way, the alignment of Hekla can be calculated, and its counterpart 30° farther to the east also! Without the knowledge of the forces underneath no one would see the resemblance.

All those places are aligned at an angle exactly between the direction of convection rolls and EW-axis. Yellowstone is in the middle of a diamond-shaped polygon, providing the basic framework for the surface tectonics.


Uncategorized

Langisjór – a very apparent feature following calculated alignment

It is a new approach to geology that the main tectonic directions of the globe can be calculated. No longer every detail has to be found out in the field, because the calculations can give guidance with accurate predictive data.

To show how this work, Langisjór in Iceland is a good example. The calculated grid of the surrounding areas of Iceland looks like this on the base of a GIS map where the degree is the base of length:

Langisjór - 01

The horizontal paths between convection rolls of different layars are drawn on the map.

We can then zoom in on this map to the scale of Iceland:

Langisjór - 03

The approximate location of the lake Langisjór is marked on the map.

Further zooming in gives us this picture on a google map:

Langisjór

The angle W47.85°N is a calculated value of the predicted alignment of the convection rolls causing the formation of volcanic zones in Iceland. Langisjór is a very good example because of its distinct volcanic features and the length scale of the adjacent volcanic formations.