Blog

geology

Etna, Stromboli and Vesuvius – how are they connected?

The three most famous volcanoes of Italy are all in the vicinity of the same convection division line:

Etna 01

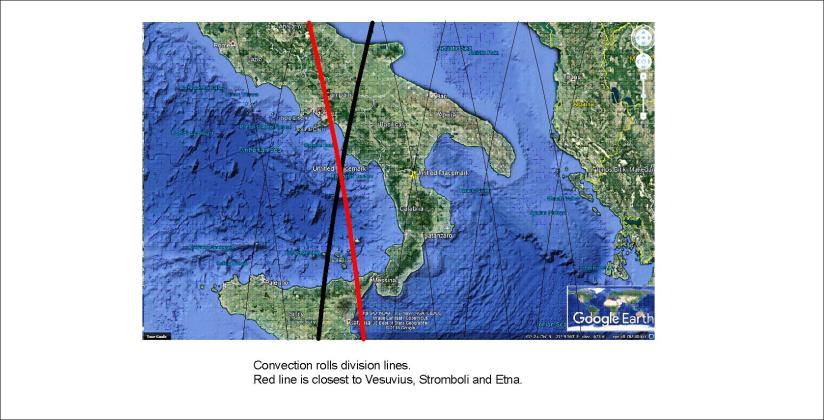
The volcanoes Vesuvius and Stromboli are directly above the line. The line represents a division between convection rolls found at about 250 km depth. The black line represents the division between convection rolls at about 120 km depth. the margins of other parallel convection rolls are marked with thinner lines.

This gives us the opportunity to think about the difference between Vesuvius and Etna. It is common knowledge that Etna is located at the border line where the African tectonic plate slides under the European one. The ascending mantle underneath can then send lava up through the crust resulting in eruptions.

Note that this analysis changes nothing about traditional geology. But it becomes easier to understand if the convection rolls under the tectonic plates are taken into account.

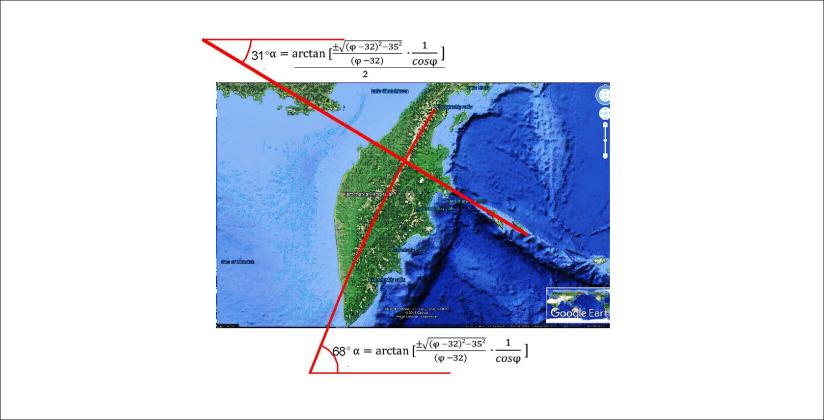
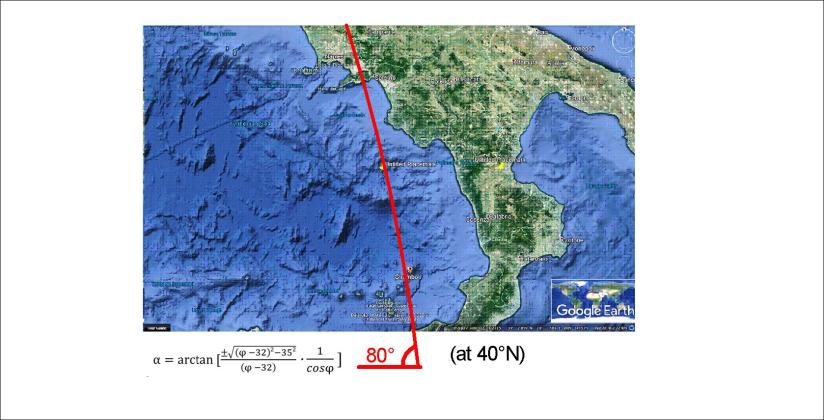
And just to emphasize that this is calculated, based on sophisticated analysis, let us compare directly with local vector.

Stromboli - Vesuvius

This is how these volcanoes are connected within the mantle. This is calculated in the same way as for the tectonics and location of volcanic and geothermal sites in Iceland.

geology

South America and Indonesia compared – subduction symmetry at equator calculated

It is fascinating that the main division points of equator are directly above the division points between convection rolls of lower mantle, which are 30° apart! But details also tell a story. Let us look at the subduction points, exactly 180° apart on the equator. This can be easily checked on a Google map:

S-America and Indonesia Compared 01

The subduction zones have the same deviation from north on equator. This alignment of the red marks, exactly on equator, is the first derivation of convection cell alignment along with north-south pressure axis.

For S-America the point above large convection cells is within the trench. The relevant lines are down-welling at the point.  At Indonesia the point is 1.5° east of the trench opening.

Just to explain the relevant conditions, The sites are here marked on the convection cell model:

S-America and Indonesia Convection Model

All this is easily understood, once you have seen the basic pattern of convection rolls within the Earth’s mantle.

Uncategorized

Juan de Fuca – following the main trend

The Pacific Ocean shows the same features as the Atlantic Ocean. A good example is Juan de Fuca, following the direction of division lines extending from equator, according to the same formula as the Reykjanes Ridge, Kamchatka and countless other distinct linear topographic phenomena. Here is the simplified drawing on a Google map base:

Juan de Fuca - 01

The number of features following the trend of the calculated alignment of convection rolls is just about endless. The secondary calculations then count for a wide range of tectonics otherwise difficult to explain. You might ask: “What are the secondary calculations?” The answer can be simple: “An example of secondary calculation is half the angle of the formula shown here. That is about W37°N or W37°S. Are there any features following that trend?”

Uncategorized

Kamchatka shows the curvature of mantle convection rolls – as the subduction counterpart of the Reykjanes Ridge!

Geology of calculations! The line of volcanoes in Kamtchatka follows the same formula as the volcanic zones in Iceland! It is exactly parallel to the Reykjanes Ridge.

The topography of Kamchatka has a very decisive linear form, and of course the volcanism there is well known. The reason for the volcanic activity is in a way opposite to that in Iceland, so it is interesting that the same formula can be applied to get exactly the correct direction following the chain of mountains, the division between mountains and lowlands etc. Here, it is shown how the curvature along the peninsula fits to the swaying form of the convection rolls underneath.

Kamchatka Peninsula - 01

The inserted lines are calculated according to φ = 57° for hemispheric convection cells. The result is N28.6°E, shown with the slightly curved line for the drawing, which fits perfectly to the peninsula. The adjacent Alpha Fracture Zone is perpendicular to the Kuril-Kamchatka Trench and thereby to the tectonic framework and topographical trend of the peninsula. The angle is close to being half the calculated value for the latitude, as shown by a line extending from the continent out to the trench, oriented N58.2°W. The half angle value is added because it repeatedly found under similar circumstances, for Hekla, California, Hawaii, etc.