Blog

Uncategorized

Geldingadalir Eruption on the Reykjanes Peninsula

The eruption that started March 19th ein the Geldingadalir valley at Fagradalsfjall on the Reykjanes Peninsula of Iceland is the first to occur within the area since the year 1240. No one can predict for how long it will proceed, but it has been found that the lava is rather hot, or between 1180-1190°C, as can be seen here: https://www.mbl.is/frettir/innlent/2021/03/22/likist_dyngjugosbergi/

The lava is therefore of the category found in shield volcanoes. Therefore the possibility that this eruption will go on for some time can not be ruled out. The crater of Thrainsskjoldur (Þráinsskjöldur) is found nearby, a large shield volcano covering the central parts of the peninsula. Now we consider this as the smallest eruptions we have seen in Iceland. If this is really an effusive eruption of ‘shield volcano category’, it surely comes as a surprise.

The dyke of Geldinigadalir eruption.

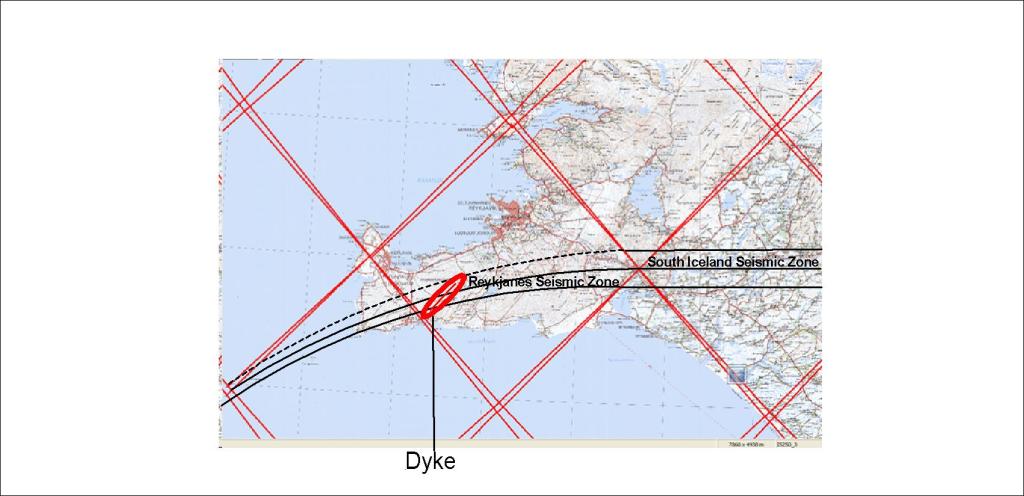
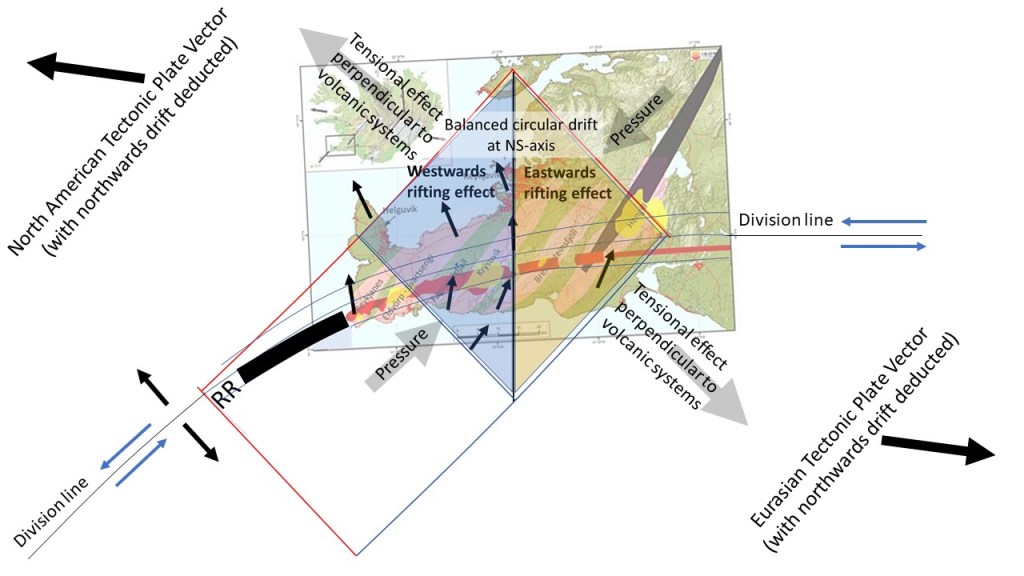
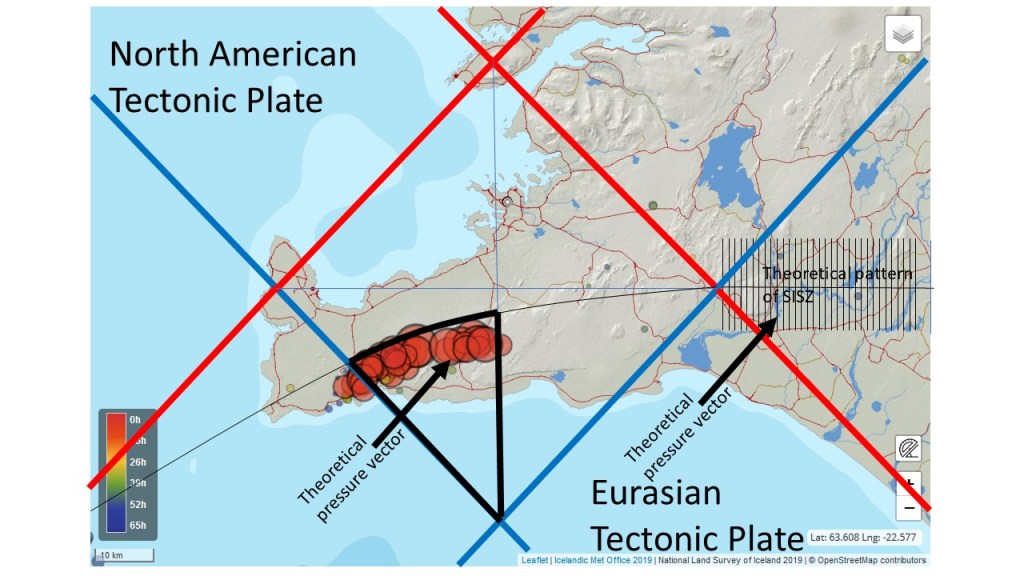
The dyke extends about 8 km over the theoretical area of the seismic zone as extended from South Iceland Seismic Zone over the Reykjanes Peninsula, bending towards the Reykjanes Ridge. It is assumed according to the model that the main part of magma is originated from NW, and when the dyke propagates to the SW, it encounters the division line of the polygon.

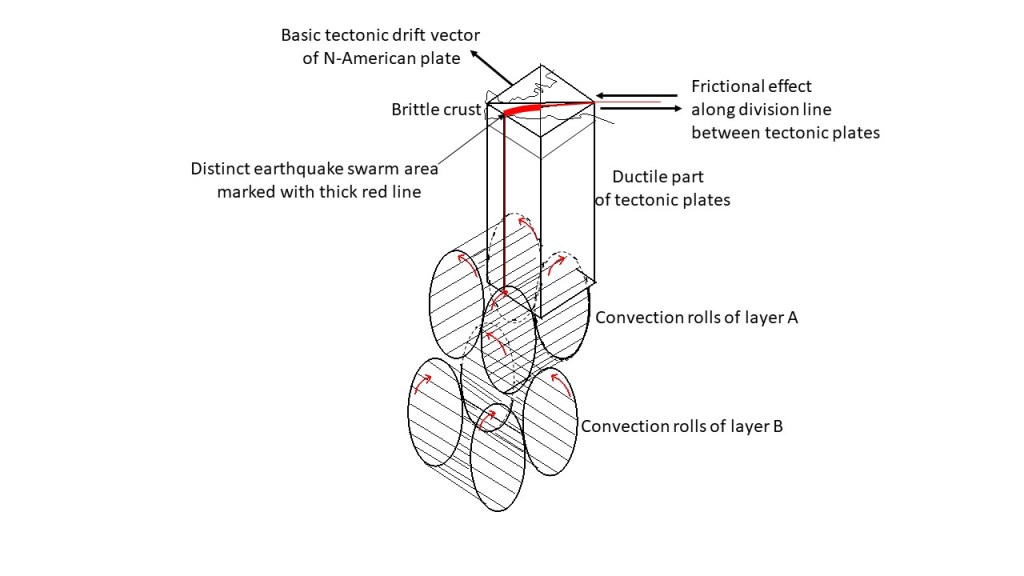
The different composition of this lava compared with the lavas erupted around 1000 years ago, can be explained according to this model with influx through the ductile mantle (below the brittle crust) from the NW division line of the Reykjanes polygon, reaching underneath the dyke into a conduit leading to the eruption site at Geldingadalir.

The material of the dyke might have propagated from the NW, and outflow could be found into the mantle at the SW end of the dyke. At least, no clue of either depletion or accumulation of magma within the earth is being measured for the moment.

The position of eruption is marked here: https://www.mbl.is/frettir/innlent/2021/03/19/upptok_gossins_eru_i_geldingadal/

Uncategorized

Dyke Formation at Reykjanes in 2021

As magma is entering the brittle crust with a flow rate of perhaps about 20 cubic meters per second, a dyke is forming in the southern half of the Reykjanes Peninsula. Geoscientists are therefore in the difficult position of explaining what is going on, and at the same time trying to predict what will happen. No one can foresee an eruption, but different scenarios are studied. Here I will show you a simple map with the main features. Convection rolls model divisions are marked with red lines. The tensional vectors are parallel to those lines. A red arrow indicates the present scope of the dyke being formed. Information from the Icelandic Met Office is found here: https://www.vedur.is/um-vi/frettir/skjalfti-m57-a-reykjanesi

Dyke formation at Reykjanes Peninsula in 2021

We are aware that, where the dyke has already formed, the magma might make its way upwards. The triggering effect might be extra heat entering the dyke, and that might originate from the convection rolls division lines found south-west of it. As the dyke propagates farther in that direction, the more likely it is that an eruption will occur according to this model. In 2014, the Holuhraun eruption started under similar circumstances.

Uncategorized

The Combination of Earthquake Zone and Volcanic Systems at Reykjanes

It can be confusing when seismic and volcanic activity is intervowen as at the Reykjanes Peninsula. Luckily, we have good information about the tectonic drift in the area, measured with GPS technology. The results are found in this report https://www.lmi.is/static/files/utgefid_efni/Maelingar/isnet_endurmael_2016_skyrsla.pdf.

On this map, I have superimposed the grid on the original map from the Icelandic Land Survey showing tectonic drift vectors.

Reykjanes Peninsula in context with convection rolls grid and tectonic drift vectors.

The drift vectors show the rotation taking place within the Reykjanes polygon. Further analysis provides this drawing:

The Reykjanes Earthquake Zone and a few relevant dynamic factors.

The small black arrows indicate the unaltered drift directions measured directly with GPS stations. It can be reasoned that the rifting process of the volcanic systmes is perpendicular to the main tensional effect within the area, indicated with light gray arrows. Similarly, pressure is excerted, creating the earthquake faults with NS alignment. The western half of the polygon seems to rotate in a semi-circular way with center at its western corner, but is at the same time subject to rifting process to the west. Similarly, the eastern half is subject to rifting to the east as compared to the NS axis of the polygon.

The earthquakes at Reykjanes Peninsula show resemblance to the volcanic systems, but occur on NS faults. This should be due to an interplay between tension and pressure within the polygon.

Uncategorized

Reykjanes Earthquake Zone in 3D

To realize what forces are affecting the earthquake zone of Reykjanes, a 3D model can be useful. The convection rolls below interact with the basic tectonic drift. Layer A has direct contact with the ductile part of the tectonic plate. Layer B has a certain degree of coupling effect with layer A, also affecting the tectonic plate. The ductile part is twisted as a result, turning anti-clockwise. Therefore, the polygon forms a rupture along the NS-axis from one corner to the other. This leads to the fact that the brittle part above may be affected by the twisting effect from below at different points of time at each side of the NS-axis.

The earthquake zone of Reykjanes Peninsula

The convection rolls are nearly perpendicular to each other. Drawn to scale. The coupling effect between layers leads to different pressure and tectonic drift directions, besides earthquakes.

The relevant earthquake swarm is shown in the previous post.

Uncategorized

An Earthquake Swarm of Reykjanes Peninsula

Comparing the unique earthquake swarm occurring today with the mathematical continuation of Reykjanes Ridge and the relevant mantle convection rolls, this pattern emerges:

Reykjanes earthquake swarm 1/4 pattern.

The earthquake swarm spans over an area within one quarter of the polygon. The faults pattern of the South Iceland Seismic Zone are shown for comparison. The faults continue into the Reykjanes Polygon, but due to the swaying effect of the central axis of the seismic zone system, the faults are likewise forced to appear farther to the south. The faults remain NS oriented within the Reykjanes part of the seismic system. Earthquake seem to occur mainly south of the central tectonic division line, as can clearly be seen on this map. The NS axis of the polygon is surprisingly decisive, resulting in a ‘1/4 pattern’ of the swarm.

Red lines show upwelling, blue lines show downwelling. The polygon is simplified and superimposed on a map from the National Land Survey of Iceland.