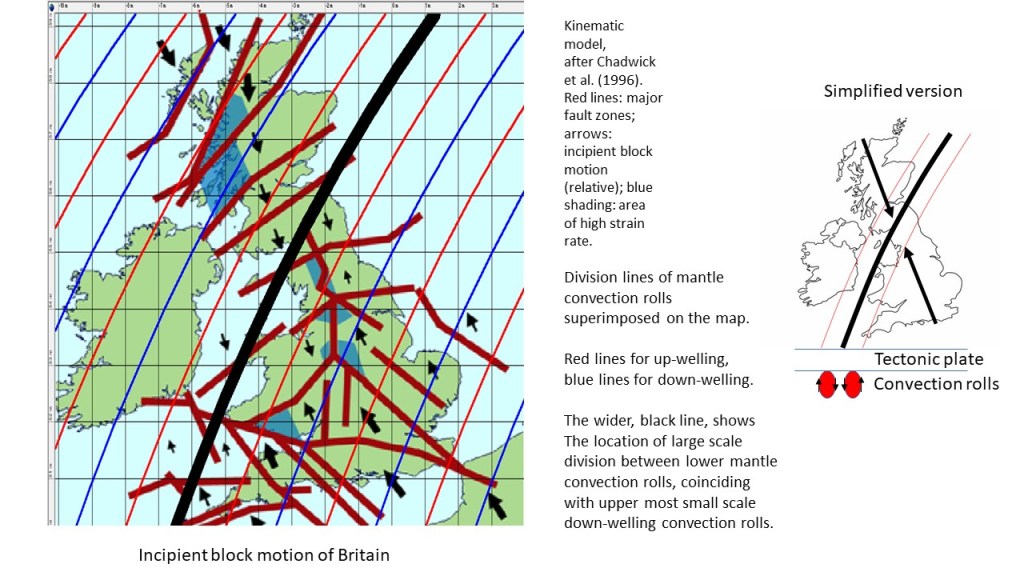
Comparing model with real measurements is essential, and it will eventually lead to better understanding of the forces behind the data we accumulate. The incipient block motion of Britain clearly converges around the line indicating main division deep underneath between two large-scale convection rolls, each spanning 30° from east to west. The upper more convection rolls do also play a role, of course, each spanning 1.5° from east to west. This drawing should explain it all:
Kinematic model of Britain with convection division lines superimposed.
Some details can also be added if the lower layer of small scale convection rolls is added.
Kinecatic model compared with convection rolls model.
Tectonic features in the north follow division lines quite closely, and high strain area (blue) in Scotland shows clear resemblance with the polygons of the convection rolls system. The arrows are more and less perpendicular to the upper more convection rolls, as might be expected.
Large scale features of the Earth can be represented with mathematics. The western side of the East European Craton is associated with the zone, and it can be clearly defined seismically, as shown here: https://www.sciencedirect.com/science/article/pii/S1611586419300034.
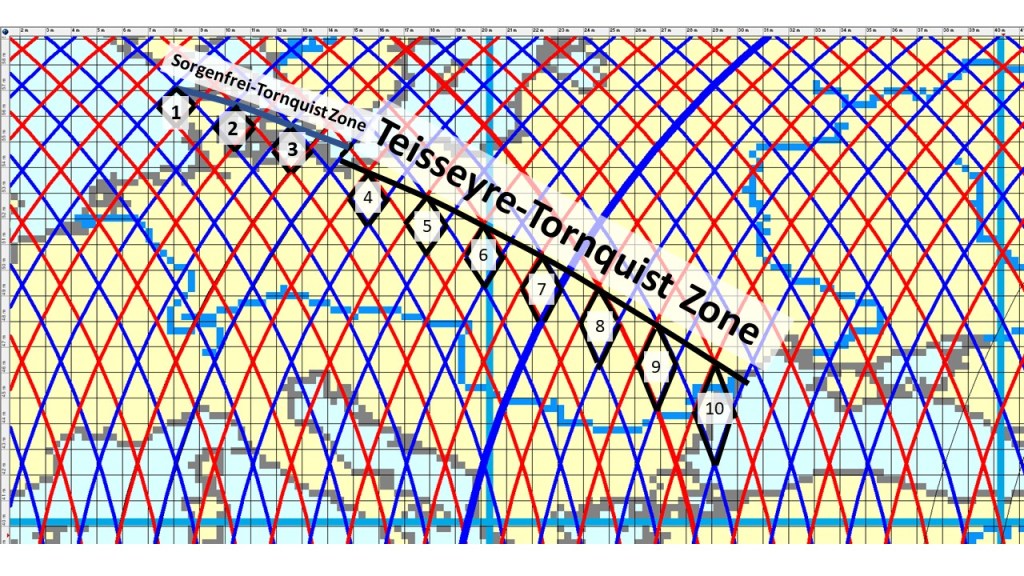
The mathematics of the convection rolls system fit to the alignment of the Teisseyre-Tornquist Zone and its Danish counterpart Sorgenfrei-Tornquist Zone. The seismicity follows the pattern of polygons very accurately, as shown here by numbering the adjacent polygons. When the alignment follows 10 polygons in exactly the same way, the accuracy and regularity indicates that the line of seismic activity is indeed affected by this pattern.
Teisseyre-Tornquist Zone and Sorgenfrei-Tornquist Zone compared with mathematical grid.
This is a main feature of Europe’s geology, and it coincides with the estuary of the Danube river into the Black Sea.
The shift from Sorgenfrei-Tornquist Zone to Teisseyr-Tornquist Zone also fits mathematically to the pattern of convection rolls, as shown here.
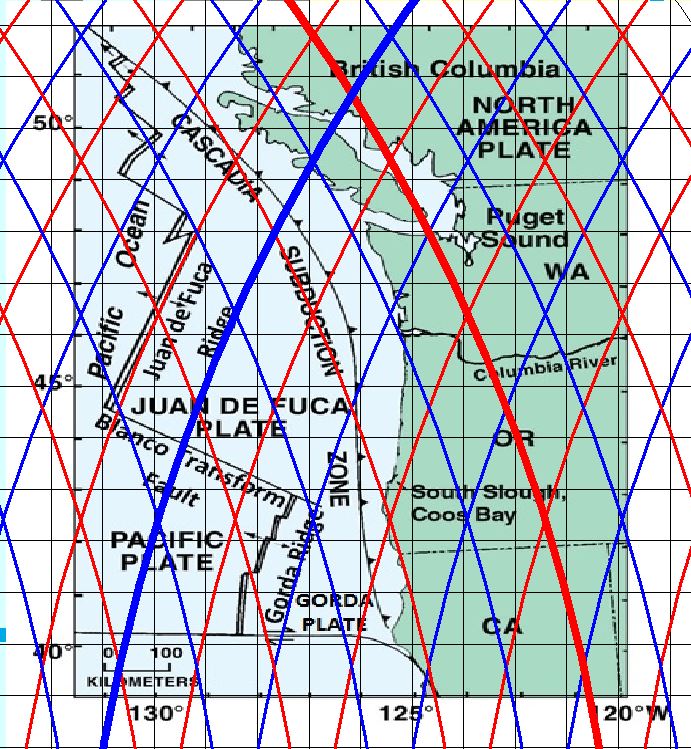
It is easy to detect the resemblance, and analysing the geophysical proberties becomes much like reading a book. The ridge of Juan de Fuca extends along a red division line (up-welling) for a distance resembling two polygons, marked by the convection rolls below.
The Gorda Ridge is of slightly different nature, because it is not found on a division line, but between them. It means that the area between the relevant divsion lines is being pulled by the main tectonic drift, resulting in the tension creating the ridge. Similar difference between features located directly above division lines (Reykjanes Ridge) and those occupying the areas above a single convection roll (East Volcanic Zone of Iceland) are aligned along the convection rolls system.
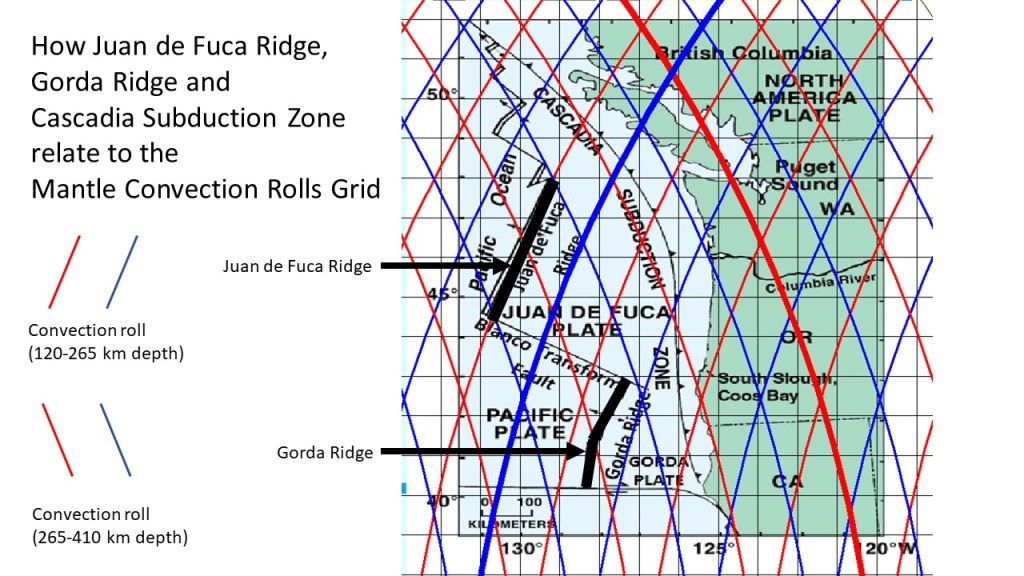
For a second look, this drawing, based on the same map as above, can be added:
Juan de Fuca system.
There are many details to be noticed, even though this map is not nearly as accurate as could be provided. The Blanco Transform Fault extends between two points where division lines cross each other, because those are points of weakness in the deep tectonic framework. The Gorda Ridge bends at the border line between polygons, as the stress field changes there. The Cascadia Subduction Zone bends back and forth along a lower convection rolls division line. As most people have not yet learned about the convection rolls system, and its implications, it is good to check the present state of knowledge regarding Juan de Fuca plate and its development on the Wikipedia site: https://en.wikipedia.org/wiki/Juan_de_Fuca_Plate.
Physics can be converted into mathematical formulas, making it easier for us to understand, design and make things work. Geology is partly about physics, and the Reykjanes Ridge follows a formula, as shown here:
Reykjanes Ridge following a mathematical formula.
Applying the same mathematics for the Mittelmeer-Mjösen-Zone of the European mainland, it turns out that it follows the same formula as the Reykjanes Ridge:
Mittelmeer-Mjösen-Zone as compared to mathematical grid, follows the same formula as the Reykjanes Ridge.
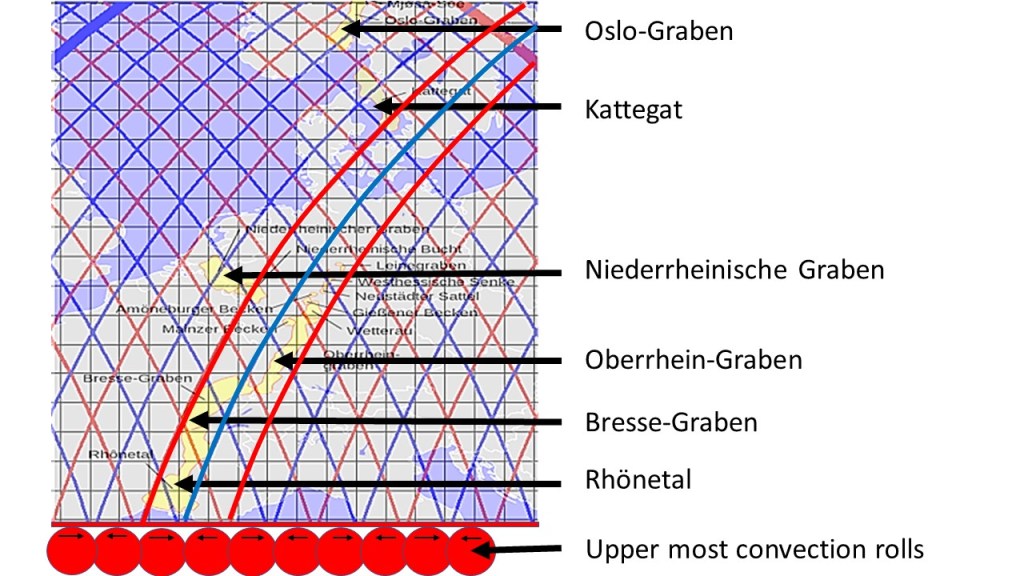
Comparing the grabens with the Icelandic volcanic zones shows a few things they have in common. 1. The wideness and scope of the grabens is the same as that of the convection rolls below. 2. The alignment follows the calculated lines. 3. A secondary trend to the NW is also present, to be explained with a presence of another convection rolls layer farther below. 4. The length of the grabens can be related to the size of polygons formed by the double-layer convection rolls system, such as the Rhonetal and Bresse-Graben.
Two different layers affecting the surface is a bit more difficult to comprehend than just the effect of the upper most layers on the tectonic plate with direct contact with each other. Different (or lower) layers do affect the surface. Coupling effect occurs between the asthenosphere and tectonic plate, but coupling effect can also take place between the asthenosphere and the next layer, leading to impact on the surface as well.
The grabens show more similarity with the Icelandic volcanic zones than to the Reykjanes Ridge, because of the width they cover. A jump from one convection roll to the other is found between Bresse-Graben and Oberreihn Graben. That must meen that clock-wise turning of a certain extent occurs around that point. That rotation has of course been measured and detected, for instance with the formation of dextral faults in the Oberreihn Graben area. The large scal tectonic drift affecting the brittle crust is then opposed locally by the upper most convection rolls, leading to the formation of the grabens.
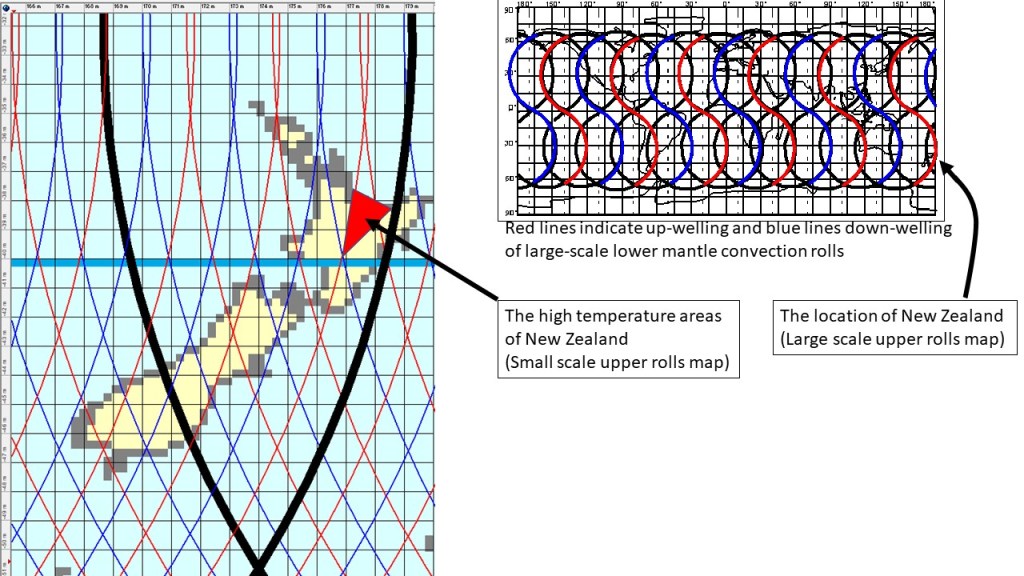
The volcanic and geothermal activity of New Zealand coincides with the Havre Trough, where the Pacific Plate is subducted under Zealandia, as explained here: https://en.wikipedia.org/wiki/Geology_of_New_Zealand
According to my analysis, main division line of the convection rolls system passes New Zealand and affects the trough, explaining anomalies in the area.
High temperature activity area of New Zealand.
The width of the area fits above one convection roll, just like the Icelandic volcanic zones. Therefore, to understand the geothermal activity of New Zealand more thoroughly, the mantle convection currents should be taken into account.