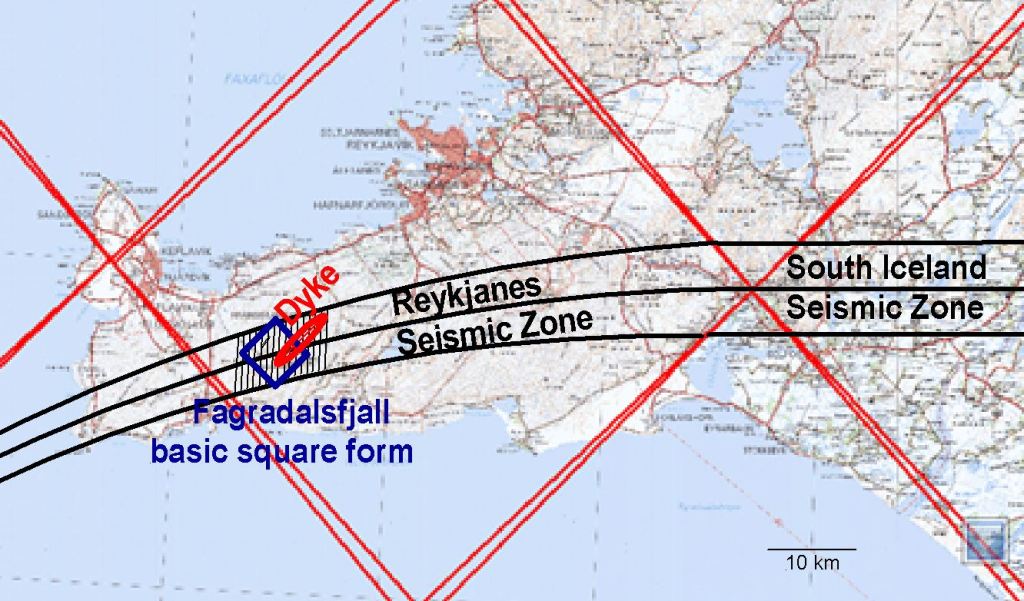
Let us draw a theoretical map showing the basic geological framework of the area. The volcanic systems are not included, except for inidcating the location of the active dyke with red elliptical form. The Reykjanes Seismic Zone is shown theoretically, along with earthquake faults around Fagradalsfjall. The apparent shape of Fagradalsfjall is shown with a blue square.
Having inserted these features, it appears that Fagradalsfjall is formed by the interaction between the volcanic and seismic activity of the peninsula. It is predicted that an eventual eruption will occur at an intersection point between the dyke and an earthquake fault. The earthquake faults are oriented N-S, wheras the dyke is oriented NE-SW.
The South Iceland Seismic Zone and Reykjanes Seismic Zone are here shown as connected, according to the Convection Rolls Model.
The main volcanic zones of Iceland can be divided into two different parts as shown on the map below. The lines representing the convection rolls model are superimposed on the map found on Wikipedia.
The best known volcanic zones are probably the West Volcanic Zone (WVZ) and the East Volcanic Zone (EVZ). The EVZ is often seen as covering five polygons, but more advanced analysis includes a distinct South Iceland Volcanic Belt (SIVB), where proper rifting process does not occur. The Westman Island (WI) are formed within a single polygon, extending from the SIVB. The Reykjanes Oblique Rift Zone (RORZ) is mainly associated with the Reykjanes Peninsula, but here the extension on the seafloor is seen as the second half of the volcanic zone. The Öræfajökull Volcanic Belt extends over two polygons in a very decisive way, in between the two volcanic sites of Öræfajöull itself at the southern end and Snæfell at the northern end. Then we still have to account for the Snæfellsnes Volcanic Belt (SVB), which can not be defined as clearly as the other volcanic zones within the context of polygons. On the other hand, Snæfellsjökull Volcano at the western end of that zone is exactly on the same latitude as Snæfell of the ÖVB, found in context with a division line in a mirrored way. Therefore, the similarities between SVB and ÖVB become quite suspicious. The Grímsey Oblique Belt is poorly known in the geological literature, but it resembles the RORZ very well, in has functional similarities. The Mid Iceland Belt (MIB) is found within one polygon, but it was connected with the now volcanically extinct Skagafjörður Volcanic Belt (SKVB). The North Volcanic Zone is found within a tighter network of convection rollls division lines, so the outer limits are not clearly defineable. but can be roughly divided into two sections, with the Mývatn area found in between. The Reykjanes Ridge then extends along many polygons to the south-west. https://en.wikipedia.org/wiki/Volcanism_of_Iceland
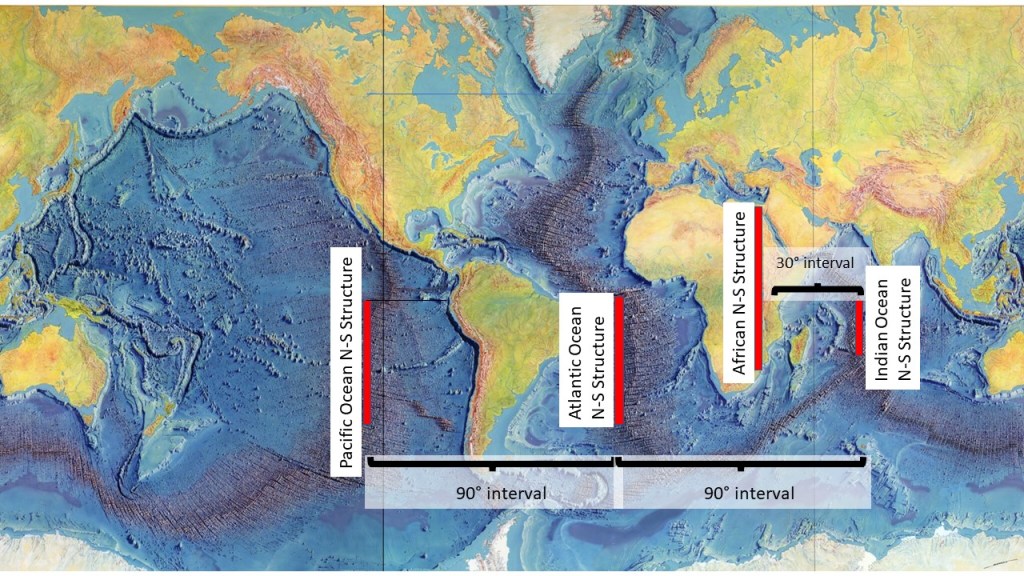
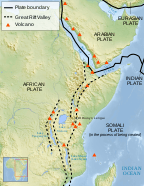
Africa has a N-S structure, combined of the Nile and the Great Rift Valley complex. These two structures are connected at equator. The Great Rift Valley is often compared with Mid-Ocean Ridges, in the sense that if it would develop further, an ocean with a mid-ocean ridge in the middle, would eventually be formed. If we simplify these structures by drawing approximate N-S lines on a map (the 1977 World Ocean Floor Map created by Bruce Heezen and Marie Tharp), a curious pattern does emerge.
The structure fits into the pattern, slightly offset to the west if compared to the Mid-Indian Ridge. All the ridges sway a little, and the intervals are not perfectly regular. On the other hand, the intervals are regular enough to deserve attention. The ridges are all N-S oriented, the starting points of the N-S oriented sections are all found at equator, and the N-S sections are very close to being parallel to each other, separated by 90°.
Let us consider the possibility that a scientist, somehow curious about the structure of our planet, would look at the fourth N-S structure of 90° intervals. The said scientist would then find a main subduction zone, exactly at that location, found east of Australia, also mainly oriented N-S. Would our imaginary scientist keep on with the investigation? My wild guess is “yes”.
But somehow, some earth scientists would not continue with the investigation. They would refrain from it, because the regular distribution of mid-ocean ridges is contrary to the “gut feeling” that they should be randomly distributed. The precondition for that intuition is our moving picture of gradually drifting plates, where the ridges should continually shift location along with the plates. Thereby, most people will consider the possibility that the ridges had a different distribution in the past, and the distribution will be different in the future. Why should we then take the current distribution of mid-ocean ridges into account, when contemplating the science of Earth’s inner structure?
If this distribution is a coincidence, and we happen to live during the time of that coincidence, we still should be able to explain why this distributional regularity does “not count”. We can make some sort of an analogy to explain that. A clock has three needles, and we all know that the distribution is random, showing all types of patterns during a 12 hours cycle. Occationally, for instance at 12 o’clock, all the needles are unified. This happens literally only for a second, and then the random distribution of the needles becomes apparent again. So now we can ask ourselves, whether the distribution of those sections of mid-ocean ridges is of the same nature as when it is “12 o’clock”?
The answer is “no”, it would be too much of a coincidence. The solution to this problem is most likely that within the Earth a regular system of mantle convection is constantly moving the tectonic plates above, but at the same time the regularity of flow is manifested in some way or another. In a billion years, everything will have changed, but the system underneath will reveal itself, just as now.
Hope that this does clarify these things to some degree, as sometimes scientific findings can be explained much better with only a few extra words.
This map from Wikipedia does show the basic tectonics. The western set of rift valleys, and the southern part including Malawi Lake form this continuous structure south of equator, and the Nile river exhibits the northern part.
The real division of equator is actually found in the eastern valley, but we have to trace the ways nature does choose.
It is well known that land mass around equator is regularly distributed. The three mid-ocean ridges of the Pacific, Atlantic and Indian oceans are found to be aligned 90° apart, directly N-S, reaching southwards from equator a couple of thousand kilometers. Studying the N-S aligned volcanic zone of Northern Iceland, it is interesting to see that it is found directly north of the Mid-Atlantic Ridge of the Southern Hemisphere. The pattern of those three N-S aligned ridges therefore form an interesting pattern with Iceland included, far up north!
How can these ridges be so regularly distributed, besides being found in context with the volcanic zones of Iceland? The answer is found in the convection rolls pattern formed by different layers withing the mantle. Together they form N-S oriented polygons, and the crust breaks in harmony with the resulting pattern. In many cases, though, ridges follow the division lines between convection rolls, and in some cases they follow other mathematical rules as well.
The fact, that the intervals between the parallel N-S sections span 90°, further adds to the feel of regularity. Each interval corresponds to the width of three convection rolls, each spanning 30° from east to west. To fully understand this, the whole system must be kept in mind, but this is a good beginning to consider what is going on.
Three mid-ocean ridges of the North Hemisphere, Juan de Fuca, Reykjanes Ridge and the Mid-Indian Ridge, are found to be mathematically correlated to each other. 1) Their alignment follows the same formula 2) The angle between Juan de Fuca and Reykjanes Ridge is 90°, and between Reykjanes Ridge and Mid-Indian Ridge is 93°. According to the Convection Rolls Model, a ridge following division line between convection roll will most likely be positioned 1.5° east or west of the main lower mantle convection rolls division line. The Reykjanes Ridge are found to be offset in opposite ways, Reykjanes Ridge being west of the line and the Mid-Indian Ridge east of the line, adding up to extra 3°.
The three North Hemisphere mid-ocean ridges. The wide lines are drawn with 30° interval.
Red lines indicate the location of the relevant ridges. The fact that the relationship is of double nature, angle and alignment, gives this model an explanatory value. The shape and location of convection rolls can be calculated very accurately, and thereby additional information can be gathered about conditions, tectonics and geological activity of any area on Earth.
This was introduced at the 48th Workshop on Geothermal Reservoir Engineering, Stanford University, Stanford, California, February 6-8, 2023.