Blog

Uncategorized

Mittelmeer-Mjösen-Zone Correlation with Reykjanes Ridge

Physics can be converted into mathematical formulas, making it easier for us to understand, design and make things work. Geology is partly about physics, and the Reykjanes Ridge follows a formula, as shown here:

Reykjanes Ridge following a mathematical formula.

Applying the same mathematics for the Mittelmeer-Mjösen-Zone of the European mainland, it turns out that it follows the same formula as the Reykjanes Ridge:

Mittelmeer-Mjösen-Zone as compared to mathematical grid, follows the same formula as the Reykjanes Ridge.

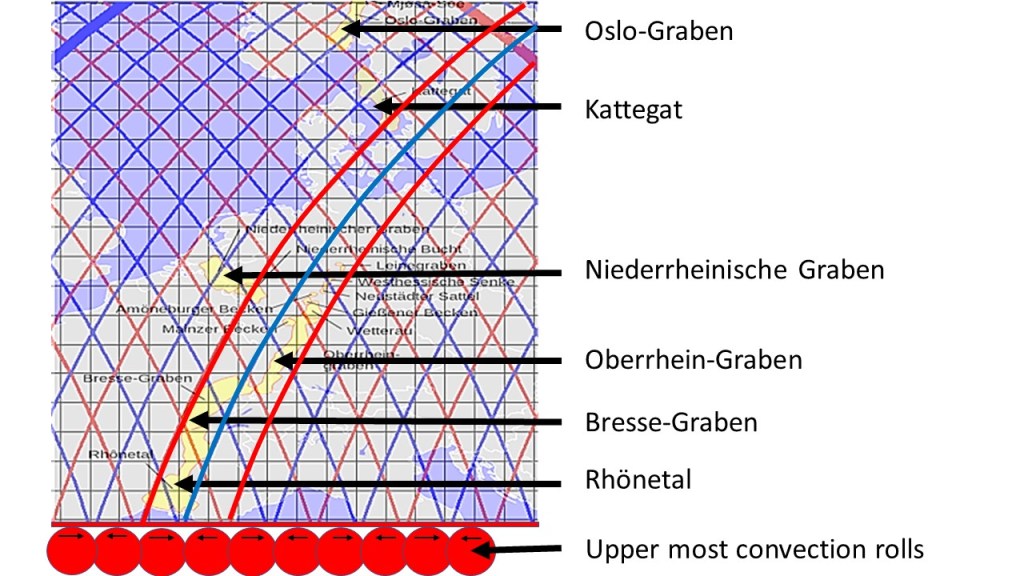
Comparing the grabens with the Icelandic volcanic zones shows a few things they have in common. 1. The wideness and scope of the grabens is the same as that of the convection rolls below. 2. The alignment follows the calculated lines. 3. A secondary trend to the NW is also present, to be explained with a presence of another convection rolls layer farther below. 4. The length of the grabens can be related to the size of polygons formed by the double-layer convection rolls system, such as the Rhonetal and Bresse-Graben.

Two different layers affecting the surface is a bit more difficult to comprehend than just the effect of the upper most layers on the tectonic plate with direct contact with each other. Different (or lower) layers do affect the surface. Coupling effect occurs between the asthenosphere and tectonic plate, but coupling effect can also take place between the asthenosphere and the next layer, leading to impact on the surface as well.

The grabens show more similarity with the Icelandic volcanic zones than to the Reykjanes Ridge, because of the width they cover. A jump from one convection roll to the other is found between Bresse-Graben and Oberreihn Graben. That must meen that clock-wise turning of a certain extent occurs around that point. That rotation has of course been measured and detected, for instance with the formation of dextral faults in the Oberreihn Graben area. The large scal tectonic drift affecting the brittle crust is then opposed locally by the upper most convection rolls, leading to the formation of the grabens.

The map showing the location of the Mittelmeer-Mjösen-Zone is found here: https://de.wikipedia.org/wiki/Mittelmeer-Mj%C3%B6sen-Zone

.https://en.wikipedia.org/wiki/European_Cenozoic_Rift_System

Uncategorized

New Zealand High Tempereature Areas

The volcanic and geothermal activity of New Zealand coincides with the Havre Trough, where the Pacific Plate is subducted under Zealandia, as explained here: https://en.wikipedia.org/wiki/Geology_of_New_Zealand

According to my analysis, main division line of the convection rolls system passes New Zealand and affects the trough, explaining anomalies in the area.

High temperature activity area of New Zealand.

The width of the area fits above one convection roll, just like the Icelandic volcanic zones. Therefore, to understand the geothermal activity of New Zealand more thoroughly, the mantle convection currents should be taken into account.

Uncategorized

The Regular Distribution of Indonesian Volcanoes

Statistics is a scientific tool and we can apply it on Indonesian volcanoes. They are evenly distributed in a row, ready to be handled mathematically. On Sumatra we have the eight volcanoes of Marapi, Talang, Kerinci, Sumbing, Kaba, Dempo, Gunung Besar and Suoh, all pointed out with an arrow on the map below. Krakatau is in fact the end volcano of that row, being also the turning point from NW-SE alignment to the E-W trend of southern Indonesia.

Distribution of Indonesian volcanoes.

The distribution fits to a system of convection rolls spanning 1.5 degrees from east to west. The layer responsible for the effect leading to the said distribution is found at the depth of 265-410 km, as shown on the map. We can then ‘zoom in’ on individual volcanoes if we want to understand better the relationship between mantle currents and volcanism within that area. It is well known that subduction of the crust leads to volcanism in the area, but the distribution of volcanoes has to be explained further by referring to the convection rolls system. Note that the famous volcanoes, Merapi and Tambora, are found on the same latitude.

The black lines indicate the location of large scale division lines, found with 30° interval from east to west. Similarly, Indonesia spans 30° from east to west along equator, and the east and west coasts coincide with the edges of one large scale convection roll of lower mantle. Red lines indicate up-welling of mantle material, whereas blue lines stand for down-welling. Further information: https://en.wikipedia.org/wiki/Volcanism_of_Indonesia

Uncategorized

The Iberian Peninsula Square

There is a reason for the square shape of the Iberian Peninsula. The northern and southern coasts were originally both cut E-W by transform faults of the Atlantic, extending from the mid-ocean ridge. Those structures clearly trend to form along the main directions of east and west, due to Earth’s rotational effect on the underlying mantle. Similarly, the west coast is aligned directly N-S, and in general the Mid-Atlantic Ridge is undisputably, as a large-scale feature, aligned N-S, although swaying back and forth. For orientation, you can watch: https://www.youtube.com/watch?v=-ye-3WGFh_Y

The result is a square shaped area, and the origin of that shape should be analysed in some detail. Here, it is explained according to the convection rolls system underneath. First, we should look at the peninsula in a clear way:

Iberian Peninsula square.

Then let us insert the relevant lines, the square itself and the convection rolls two layers pattern:

The Iberian Peninsula square inserted, along with convection rolls division lines.

We are so used to looking at maps, that the special shape somehow escapes from our attention, but drawing the square it can not be denied that it follows the E-W and N-S alignments very closely, and would be statistically unimaginable as a coincidence. This can be explained, providing an opportunity to enjoy this geological aspect of the area.

The Wikipedia article about the Iberian Peninsula: https://en.wikipedia.org/wiki/Geology_of_the_Iberian_Peninsula

Uncategorized

Different Slope of East and West Oriented Subduction Zones

There is a clear difference between subduction zones facing east (slope 27.1°) and west (slope 65.6°), on the average. The first reason to be examined is Earth’s rotation. Slab is subducted about 660 km, close to 1/10 of Earth’s radius, and therefore it loses rotational velocity on the way. As this happens very slowly, it might be overlooked, but this is actually what happens. All this mass loses considerable amount of kinetic energy to the environment during the process. This fact constantly alters the slab dip as it descends into the mantle. It occurs linearly, having rotational speed u=1 at the surface, and u=0.9 close to the depth of 660 km. The Earth’s radius is 6,370 km, and therefore we roughly say that when fully subducted it has lost 10% of original rotational velocity.

This is shown here with the drawings below. Two rather similar triangles appear, as it is supposed that the lithosphere plates subducted westwards and easwards are affected equally by the difference of rotational speed, only with opposite signs of plus and minus. The distance gap is shown with the short line of the triangle, connecting the red line of real flow, and the black lines of imaginary trend of no rotation. Those lines are found to be accurately in between 65.6 and 27.1, or about 46°.

Different rotation velocity, of the Earth, with depth explains dip of slab in subduction zones.

The information about average dip of slab is from the article ´Polarized Plate Tectonics´ (2015), by Carlo Doglioni and Giuliano Panzax.