Blog

Uncategorized

Comparing volcanic sites

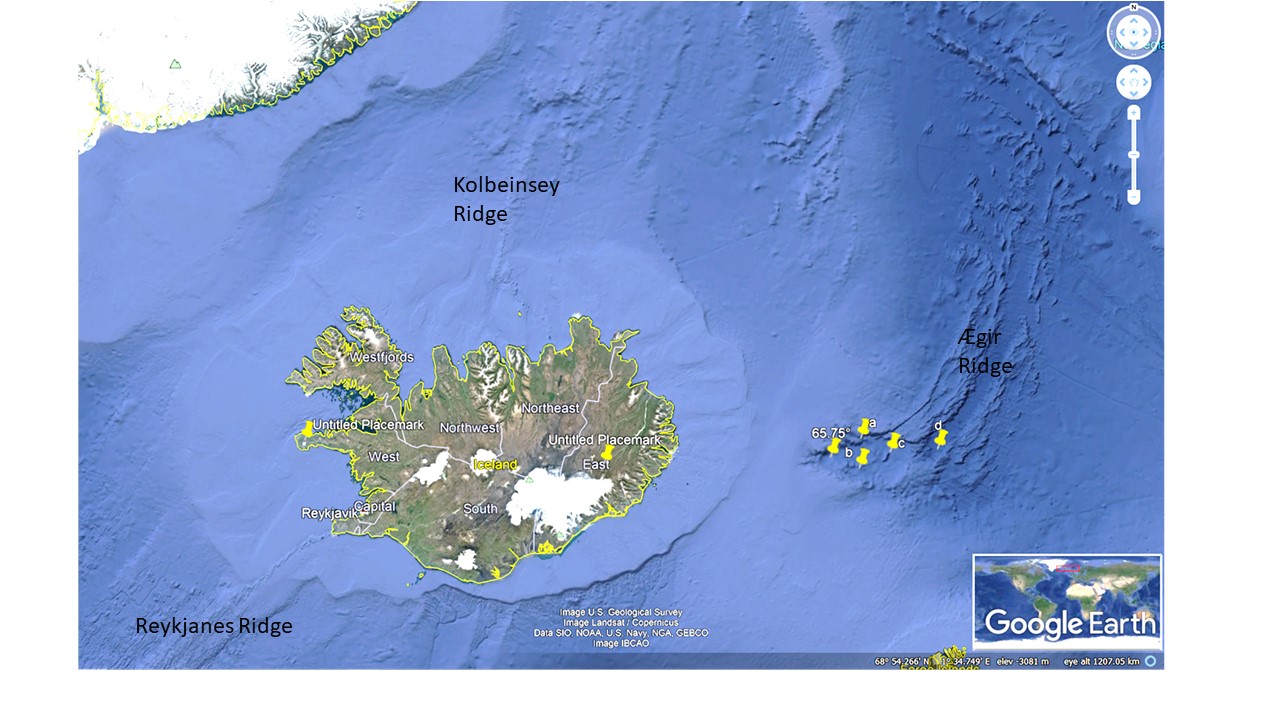
Comparing different maps with the grid of convection rolls found in layers under Iceland is necessary. Here is one example, comparing with a simple map from the Iceland Magasine https://icelandmag.is/article/icelands-northernmost-settlement-and-tallest-peak-tremble-quakes-oraefajokull-and-grimsey

The grid and the volcanic systems

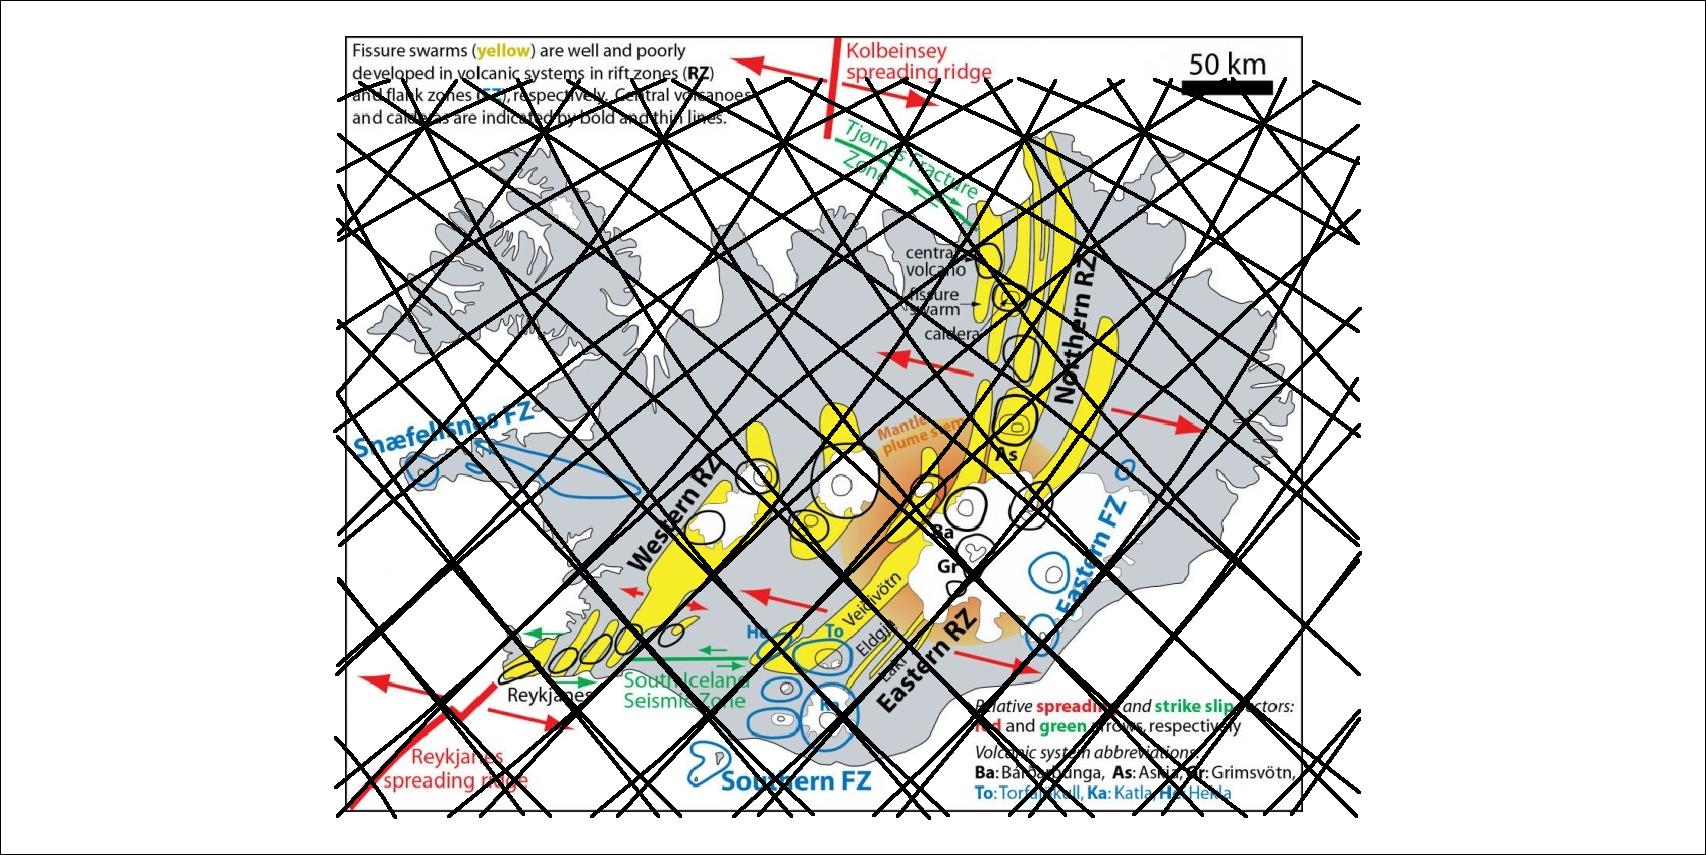
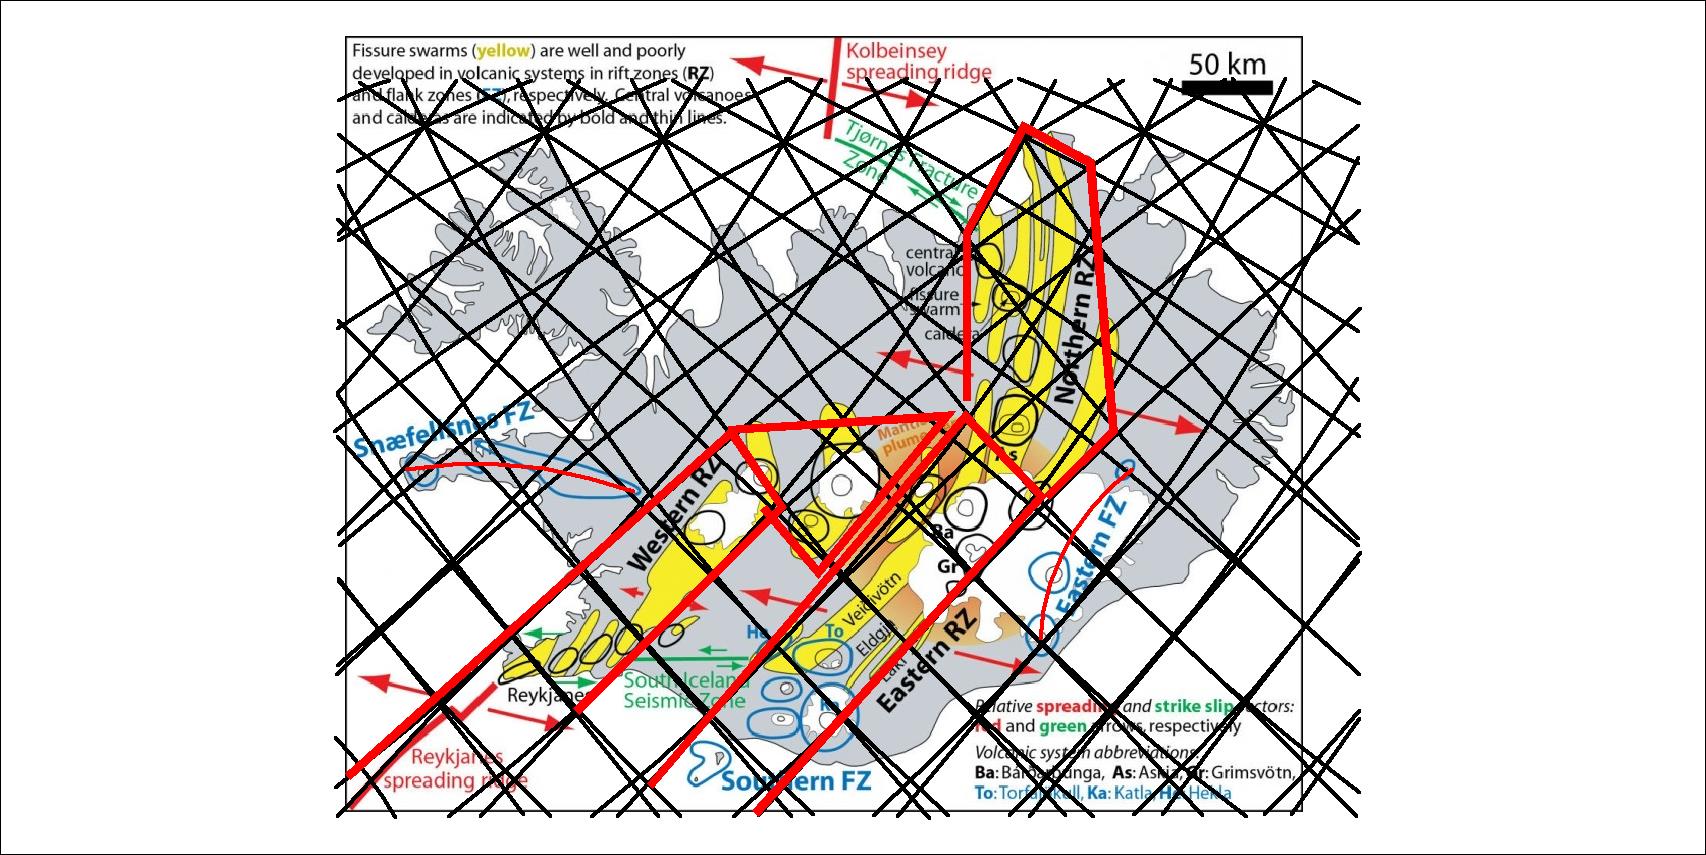
By showing the polygons mostly includen, the two volcanic zones of the south, can be marked clearly, and the north volcanic zone becomes tracable as well. The two zones of Snæfellsnes and Öræfajökull clearly span over relevant polygons.

The polygons of volcanic zones marked specially
Uncategorized

The Ocean Ridges and Mantle Rolls Alignment

The Ocean Ridges around Iceland follow the calculated alignment of convection rolls, as shown here:

The ridges compared with convection rolls.

The resemblance is also found for the volcanic zones of Iceland as marked. The two axis the Icelandic ocean floor plateu parabola are marked to show the resemblance with the end of the old, formerly active, Ægir Ridge. Green circle shows the parabola of the ocean floor platform of Iceland, which is almost identifiable with a single look on a Google map. Analysis of that platform shows the two axis, one NS-axis through Hekla, the other EW-axis through Snæfellsjökull and Snæfell. A vertical view from Google maps can be viewed for comparison:

The three ocean ridges around Iceland


Uncategorized

A little test for similarities between the NW and East of Iceland

In some posts here, it is postulated that similarities can be found between the Strandir area in NW Iceland and the East Fjords. Marking the extinguished volcanic sites of the NW with circles and comparing with the East, it actually fits. Extinguished volcanic sites are found at the same locations, at first sight beyond sheer coincidence.

The old volcanic sites of the NW compared with the East Fjords.
Drawn on map base from Náttúrufræðistofnun (The Icelandic Institute of Natural History).

The parallel origin of these areas seems to lead to a similar distribution of volcanic sites. This is by no means a thorough comparison, as this is just to point out an idea for those interested in geoscience to compare those areas.

Uncategorized

The interior

Humanity is missing something, not knowing about the mantle currents within the Earth. Here is a drawing for explanation:

The globe and the mantle current pattern within it

This is a beginning, as the layers of inner core, outer core and mantle are shown. The same laws of physics are used for the analysis for all the layers. Measurements and physics fit together! In other words: The measured thickness of each of Earth’s layers does match with an arrangement of convection rolls. These rolls are expected to form according to the laws of physics, namely convection within a rotating globe.

Uncategorized

The Atlantic at equator – why it does span 60° from East to West

This measurement is as simple as possible, as along equator there are exactly 60° from Africa to South America. After billions of years of tectonic drift, this is a fact.

The convection rolls under the Atlantic Ocean

This can help us understanding the convection rolls system in general. And it can also teach us that nature behaves in a more complex way than we think at first. A linear thinking method makes us reason that the wideness of the ocean must be arbitrary. In nature, continuous movements are constantly subject to physics and show regularity and linear procedure at the same time. Understanding this, we can trace the tectonic drift backwards with more accuracy than before.

The equatorial section of Earth

The Atlantic Ocean spans two of those cells (sections of convection rolls), as can be seen here were the layers of Earth are drawn to scale.