Comparing model with real measurements is essential, and it will eventually lead to better understanding of the forces behind the data we accumulate. The incipient block motion of Britain clearly converges around the line indicating main division deep underneath between two large-scale convection rolls, each spanning 30° from east to west. The upper more convection rolls do also play a role, of course, each spanning 1.5° from east to west. This drawing should explain it all:
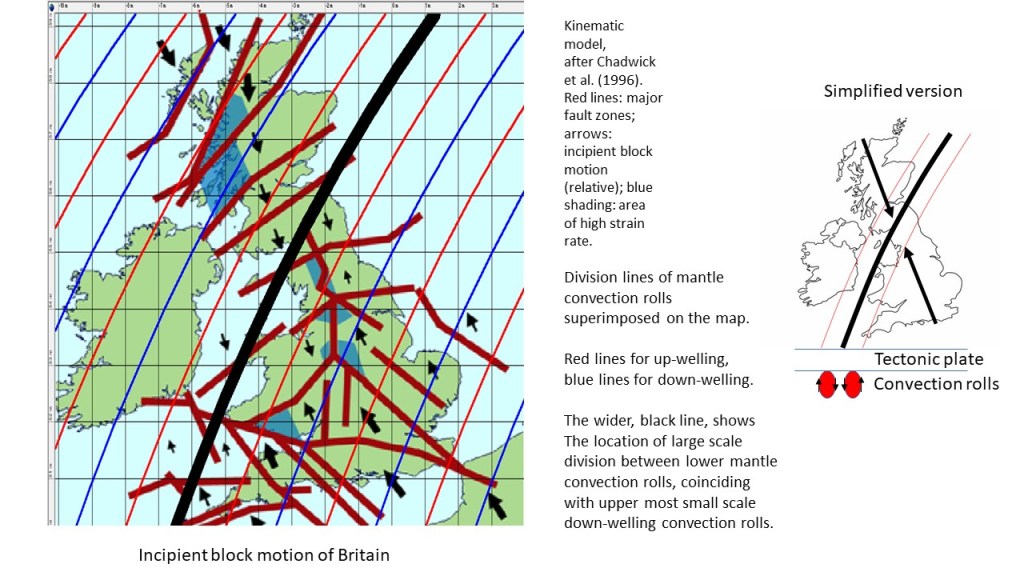
The basic map is found at https://www.semanticscholar.org/paper/Eurocode-8-seismic-hazard-zoning-maps-for-the-UK-Musson-Sargeant/305db484dc32f4cae5158d6d83132dc97b10c1b1/figure/10
Some details can also be added if the lower layer of small scale convection rolls is added.

Tectonic features in the north follow division lines quite closely, and high strain area (blue) in Scotland shows clear resemblance with the polygons of the convection rolls system. The arrows are more and less perpendicular to the upper more convection rolls, as might be expected.
