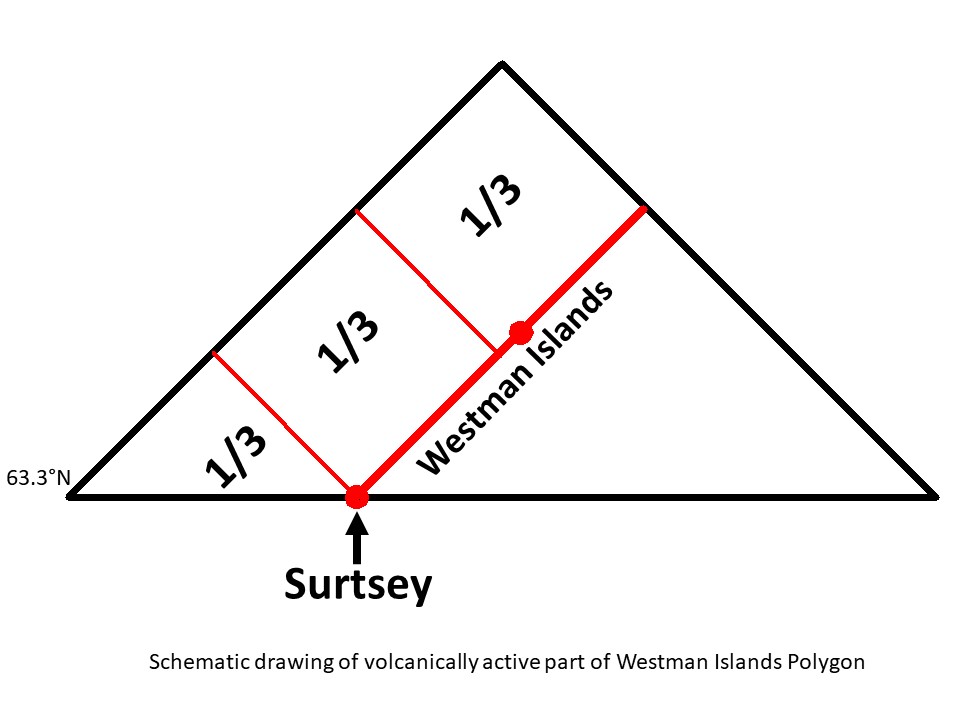
The Westman Islands are mainly distributed along a line from SW to NE, and Surtsey happens to be the outermost point to the SW. The outer framework is a polygon, of which only the northern half is volcanically active. The polygon is subject to the effects of tectonic drift and magmatic intrusion, and tends to be divided into regular parts. First, an E-W axis is formed, as is common for other polygons nearby. Then, the northern half is divided into roughly 3 parts, as shown here:
The Westman Islands Polygon.
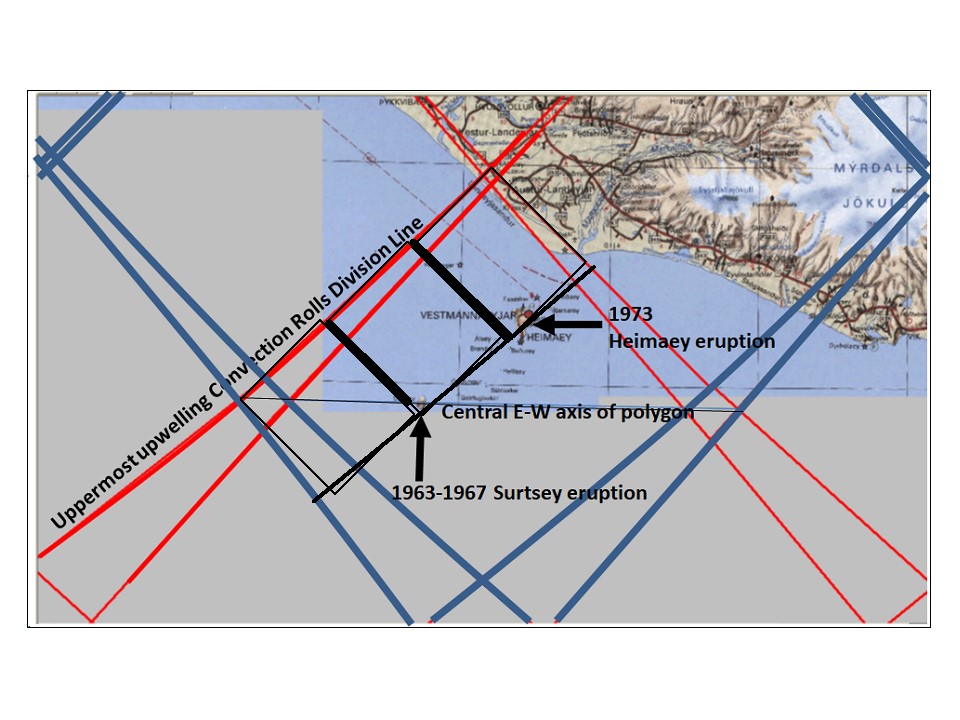
The real picture is of course somewhat more complicated, as seen here:
Westman Island Polygon – Divisions due to tectonic drift marked with black lines.
Looking at the Geldingadalir eruption, the 1/3 divisions are also dectable there, but partly distorted because the division line between N-America and Eurasia is swayed, so a direct E-W axis between east and west corners does not form.
Breakup trend of Reykjanes Polygon
The similarities between the two polygons are striking, and it is curious that these somewhat parallel events occur within a century. This is also one clue about the eventual duration of the Geldingadalir eruption.
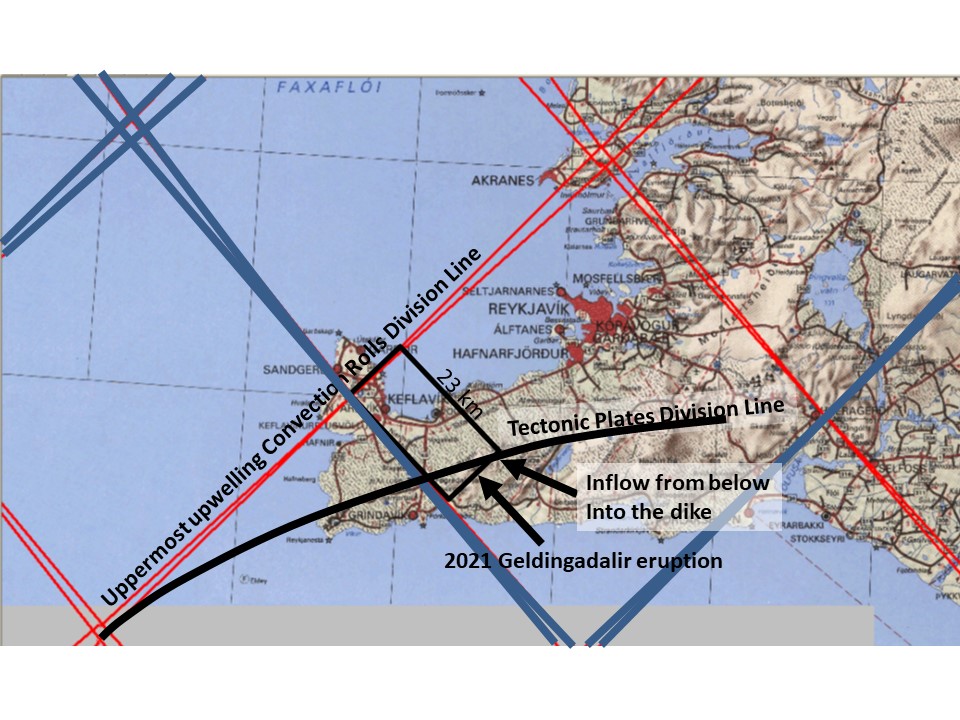
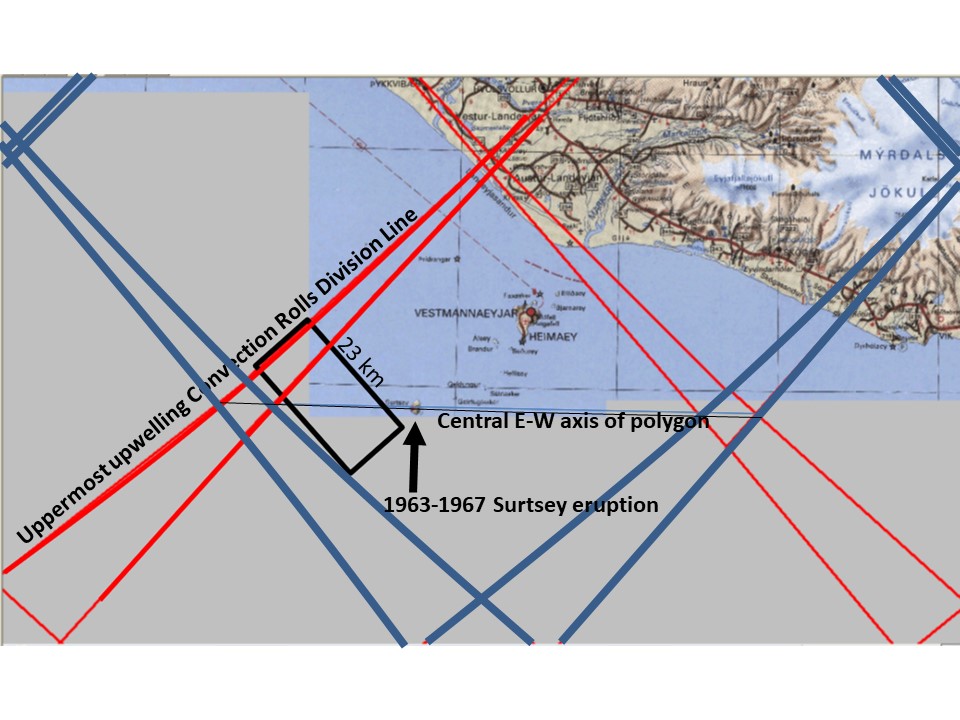
Noticing the similarities between the two eruptions of Geldingadalir and Surtsey, we should also be aware of the differences. Let us have a look at the maps:
Geldingadalir eruption for comparison with Surtsey eruption.Surtsey eruption for comparison with Geldingadalir eruption.
Identical squares with the length of 23 km have been inserted for orientation. The similarities can partly be explained referring to the central axis of the Westman Islands Polygon on one hand and the division line between the N-American Tectonic Plate and the Eurasian Tectonic Plate on the Reykjanes Peninsula on the other hand.
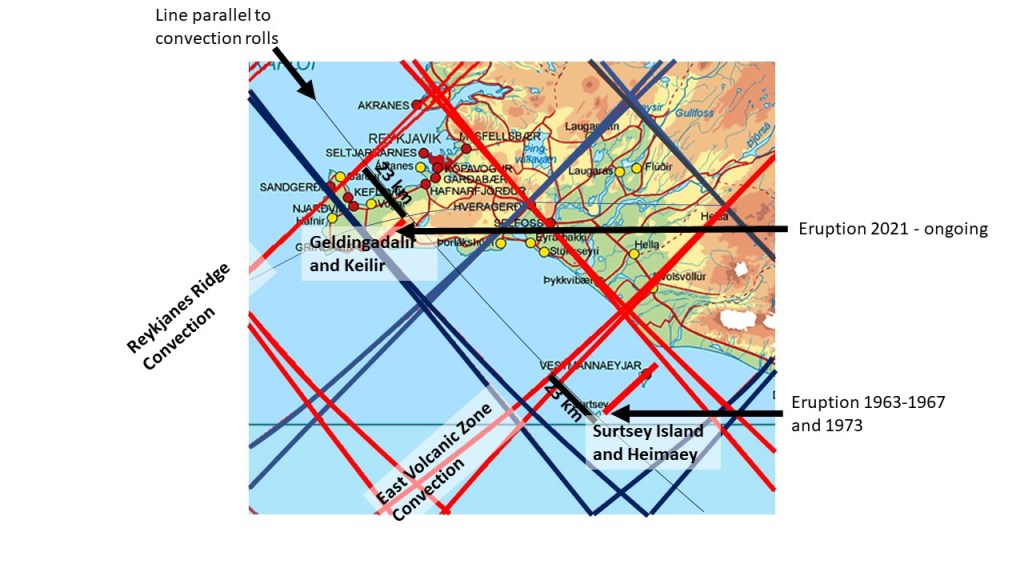
Scientists have already mentioned that Surtsey and Geldingadalir eruptions have something in common. Both have the characteristics of effusive eruptions (shield volcanoes), and the flow rate of basaltic lava is similar. Looking at the convection rolls model, the two locations of ascending magma are exactly parallel to each other. Comparing the framework of the two polygons of Reykjanes and Westman Islands, they are alomost copy-paste of each other. In turn, Surtsey has the same location within Westman Islands Polygon as has the ascending magma where it flows into the dike of Geldingadalir eruption, close to Keilir Volcano.
The parallel geometry of Geldingadalir and Surtsey.
The narrow, black line, parallel to the NW-SE trending convection rolls division line (blue), does cross the ascending spots of magma for Geldingadalir and Surtsey. The Geldingadalir eruption is fed by a dike, but the flow into the dike is not directly below the eruption site, but closer to Keilir Volcano, farther NE. Considering that the lower inflow of magma was more or less directly below Surtsey, the spots are identical for the polygon of Reykjanes and polygon of Westman Islands.
Scientists have reasoned that Surtsey eruption and Heimaey eruption in 1973 were actually connected events, meaning that magma from Surtsey was connected with Heimaey. Therefore we can draw a line in between Surtsey and Heimaey. That line is parallel to the dike formed at the Geldingadalir eruption site. It is tempting to consider that the dike did also extend to the SW from Surtsey, towards the downwelling division line (blue color).
The differentiation of the magma entering the eruption site of Geldingadalir in Iceland tells a story. The magma did become more primitive quite rapidly as this graph shows:
This tells us that the lava ascending at first to the surface must have had time for differentiation, whereas what follows has not been altered in the same way. This makes sense if the magma did flow some distance horizontally before entering the dike and eventually the eruption site. This is one argument for speculating about the existence of another, lower dike, being aligned perpendicularly to the upper dike.
The eruption is developing stepwise, and now higher fountains of lava are measured to have reached over 200 meters hight.
The eruption of Geldingadalir on the Reykjanes Peninsula in Iceland – May 2nd 2021.
The Convection Rolls Model, used here to explain various geological phenomena, can be used to trace the flow of magma within the tectonic plate. The flow below the brittle part of the cryst can nor be monitored, because it does not cause earthquakes. Also, it does not cause any alterations on the surface, so we can just make a wild guess.
Therefore, I use the model. and speculate how the eruption could occur within the model. Model is not reality, just a tool to eneavour to find something out about the real world. A guess based on a model can then be a used to make further research and investigations.
First, let have a look at the three dimensional drawing:
Large scale model of upper convection rolls with eruption site.
Then we can have a closer look on a map, showing the convection rolls division lines from above.
Map showing upwelling point and downwelling point of the model.
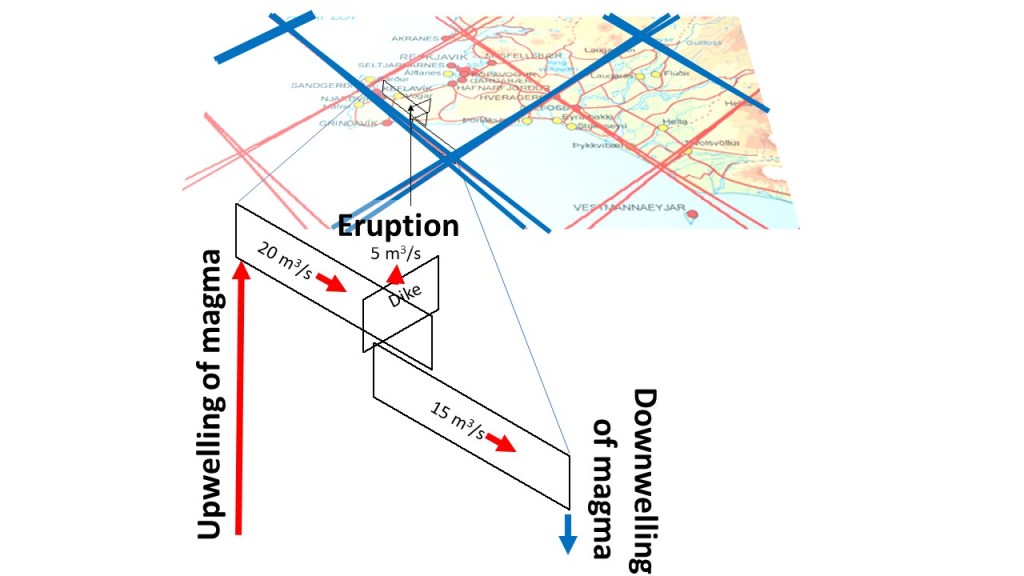
To see how the model works, the two lower dikes have to be drawn in 3D.
The three dikes responsible for the eruption.
This drawing shows how magma enters the ductile part of the tectonic plate, and the lowermost part of the brittle crust, still not causing earthquakes or uplifting of surface. The hidden dike, probably around 10 km below the surface, of unknown height and width, channels magma towards the inner part of the polygon, until it reaches the central part near Keilir, where it ascends into the brittle crust, forming the dike responsible for the eruption at Fagradalsfjall. Out of 20 cubic meters per second, five are lost due to the eruption, but the remaining 15 proceed to the next lower crust dike, flowing all the way to the other side of the convection roll, where downelling occurs.
This might explain how the flow can be maintained for a relatively long time. The extra 15 cubic meters per second maintain the temperature and flow paths within the upper dike. The standard 5 cubic meters flow of the eruption are then related to the width of the dikes, and the upwelling through the crust originated from the convection rolls division lines, where the original melting should have taken place.
This can not be proved with any measurements at hand, so this is just an analyzis of what should happen according to the model, and these ‘lower dikes’ might not exist at all. Take care to know the line between the known and the unknown 🙂