I am a geologist, graduated from the University of Iceland, and taught geology for a few years. I have gained some knowledge about Earth's inner structure, so I provide this website as my contribution to answer one of the greatest questions remaining within the realm of geoscience. Experiments show that the mantle should form convection rolls when close to the melting point. I took this literally, and calculated the dimensions and shape of these mantle convection rolls. Then I compare that model with the surface. This makes it possible to provide many interesting examples about geology found on my blog.
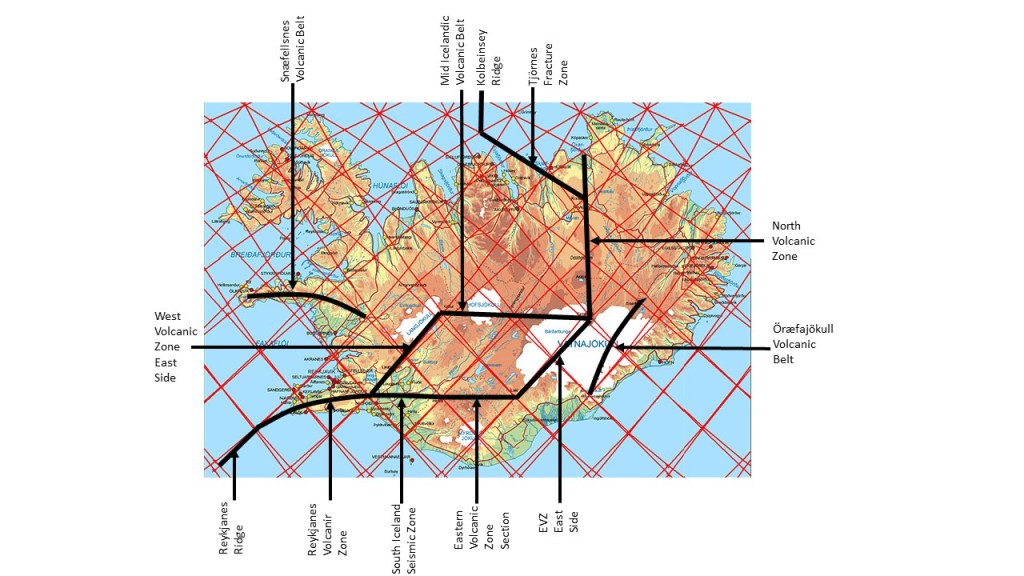
The grid of convection rolls explains the tectonic framework of Iceland:
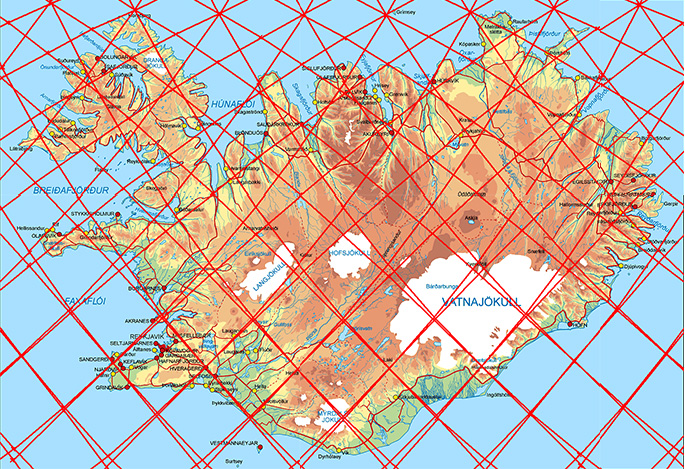
Outlines of the Tectonic Framework of Iceland
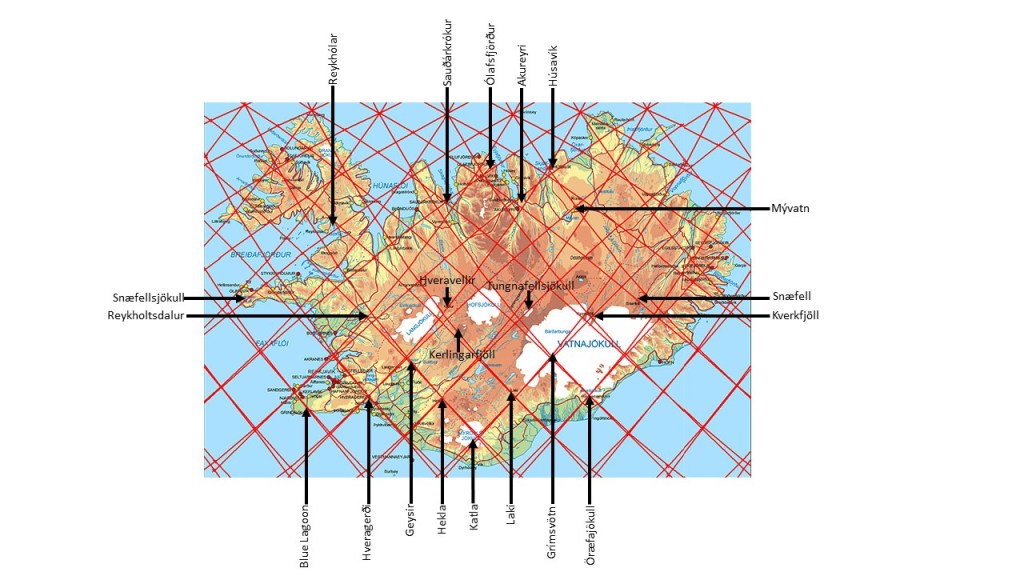
The same applies for main volcanic and geothermal sites:
Some Volcanic and Geothermal Sites in Iceland
The tectonic framework shows direct resemblance with the model of convection rolls found under the country. Likewise, many volcanic and geothermal sites are found in context with the crossings of division lines of different layers of mantle convection rolls.
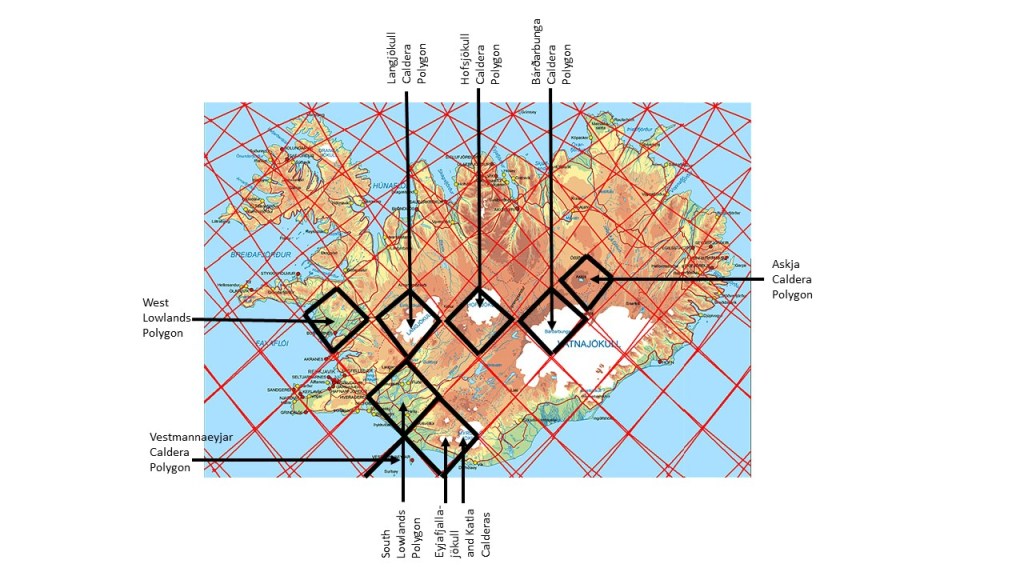
Besides this, we can look into the polygons of the network of division lines between convection rolls of different layers:
Polygons compared to distinct areas
The calderas along the central parts of Iceland have the function of providing magma for dikes to fill up the void created by tectonic drift.
It is obvious that the drift vectors only approach the alignment of the convection rolls in Iceland. The uppermost rolls are aligned from NE to SW, and in the NW part of Iceland these rolls should be driving the drift. Rolls opposing the drift should be decoupled, and rolls following the drift should be coupled.
Different layers can get coupled and decoupled, so the combined effect of lower layer can be felt at the surface with movements of the tectonic plate. An intersection layer is found between convection rolls layers, and between the upper most convection layer and the ductile lower most part of the tectonic plate as well.
With these factors in mind, it will be possible to analyse and trace the geological history.
To further show the double nature of the two rift zones of the southern half of Iceland, this map should be added:
The effect of the West Volcanic Zone added
The eastern margins of West Iceland Volcanic Zone and East Iceland Volcanic Zone are 3° apart from east to west along each parallel. The pulling effect of the North Americal Plate to the NW causes rifting, as the local small convection rolls underneath flow into opposite direction. This creates and area with rather northerly oriented drift vectors.
At Vatnajökull, the Eurasian plate slides along the side of the East Volcanic Zone, contributing to the fact that the geology of East Iceland has much more holistic appearence than that of West Iceland.
The two main lowland areas are marked on this map:
The two lowland areas of South and West
The outlines of the lowlands are obvioulsly marked by the convection rolls division lines.
The lowland areas compared with uppermost division lines
The Reykjanes Ridge uppermost division line does cross the geothermal area of the West, whereas the large geothermally active area of the South is found mainlu within a triangle, north of the South Iceland Seismic Zone (and within it), inside the polygon of the Southern Lowlands.
This grid can be used for reference, explaining tectonic features of Iceland.
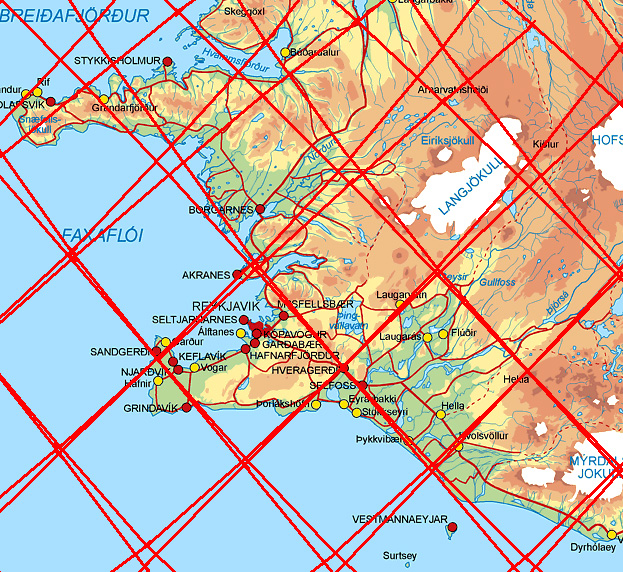
Having a closer look at Reykjanes Peninsula:
Reykjanes Peninsula and the SW part of Iceland
The Icelandic Met Office
The division lines of layer 2 and 4 between 120-410 km below the surface cross the earhquake swarm from SE to NW. A volcanic system and a seismic zone are also found within the area.
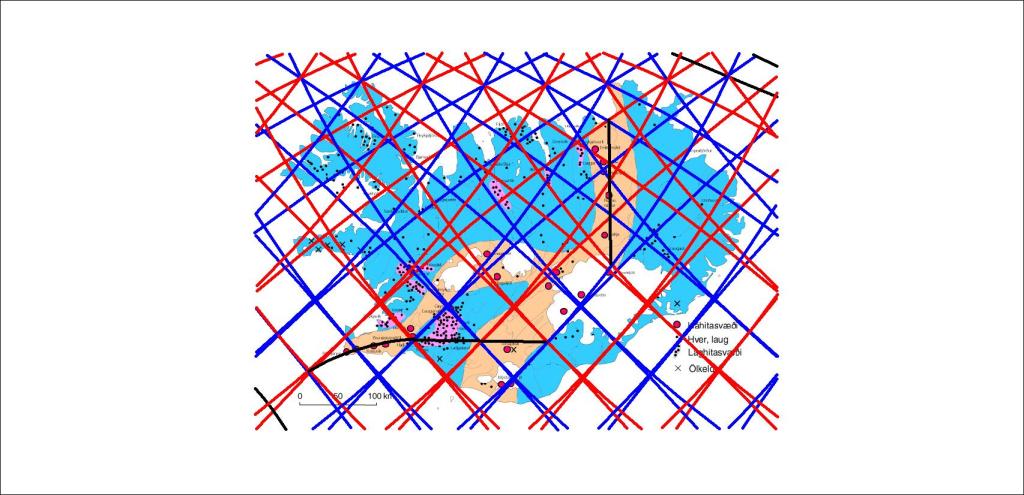
Comparing the convection rolls with the distribution of geothermal heat, a correlation is found. 1. Between division lines and high temperature areas. 2. Between tectonic plate division line and high temperature areas. 3. Between polygons and low temperature areas.
Map from Náttúrufræðistofnun Íslands showing geothermal areas
The consistency is quite obvious, but also it can be pointed out how Kverkfjöll, Askja and Fremrinámar occupy each one polygon. Geysir in Haukadalur, Hveravellir and Kerlingafjöll are found above mantle rolls division lines.
As for low temperature, the concentration within certain polygons is a special study.
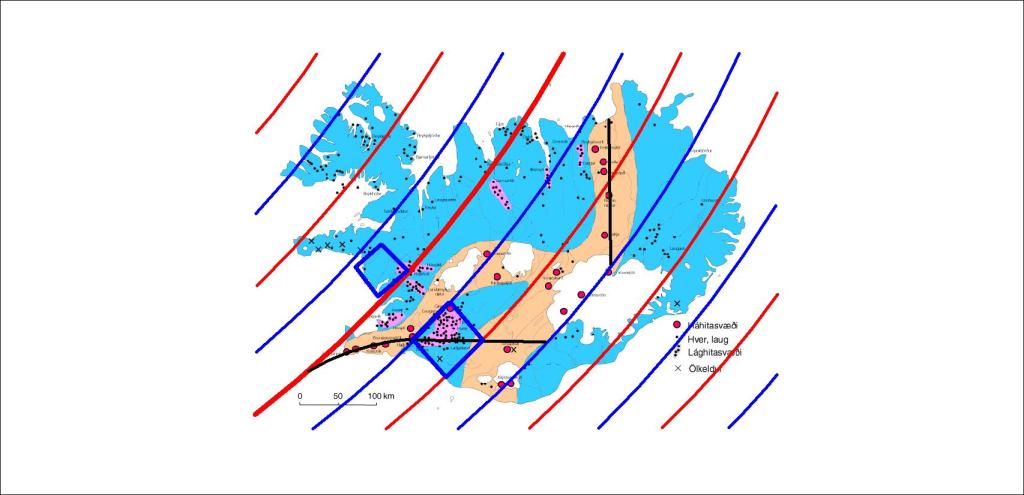
The correlation is even clearer on this map from the wikipedia page about geothermal heat in Iceland:
Correlation between convection rolls and geothermal areas.
The outer border shape of low temperature areas follows the polygons. The five main areas shown here are for the Southern Lowlands, Reykholtsdalur, Skagafjördur Eyjafjördur and Skjálfandi, all show this trend.
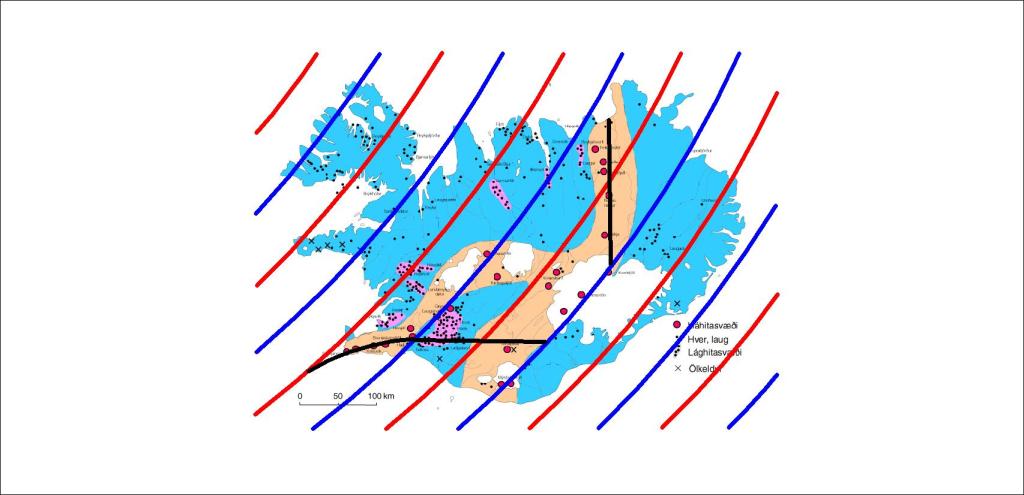
The easiest way is to concentrate on the uppermost layer, found belwo the tectonic plate at 120 km depth. Then the division lines between the convection rolls are shown more clearly.
Only the uppermost layer of convection rolls shown, red for upwelling, blue for downwelling, along with division between tectonic plates with a black line.