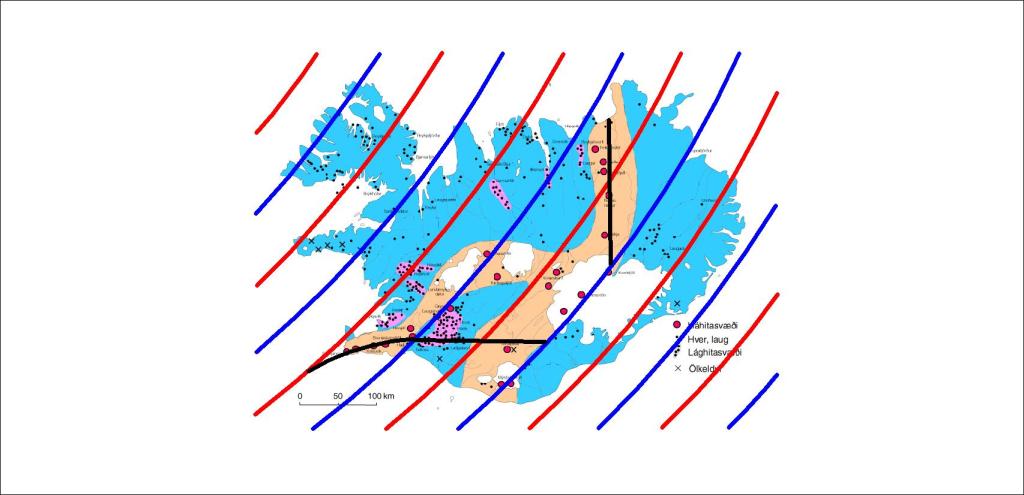
Comparing the convection rolls with the distribution of geothermal heat, a correlation is found. 1. Between division lines and high temperature areas. 2. Between tectonic plate division line and high temperature areas. 3. Between polygons and low temperature areas.

The consistency is quite obvious, but also it can be pointed out how Kverkfjöll, Askja and Fremrinámar occupy each one polygon. Geysir in Haukadalur, Hveravellir and Kerlingafjöll are found above mantle rolls division lines.
As for low temperature, the concentration within certain polygons is a special study.
The correlation is even clearer on this map from the wikipedia page about geothermal heat in Iceland:
The outer border shape of low temperature areas follows the polygons. The five main areas shown here are for the Southern Lowlands, Reykholtsdalur, Skagafjördur Eyjafjördur and Skjálfandi, all show this trend.
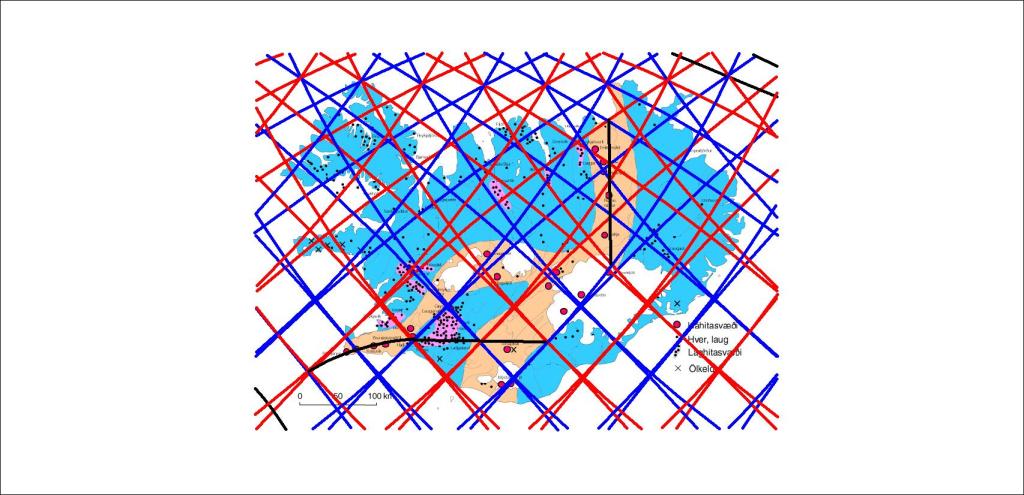
The easiest way is to concentrate on the uppermost layer, found belwo the tectonic plate at 120 km depth. Then the division lines between the convection rolls are shown more clearly.