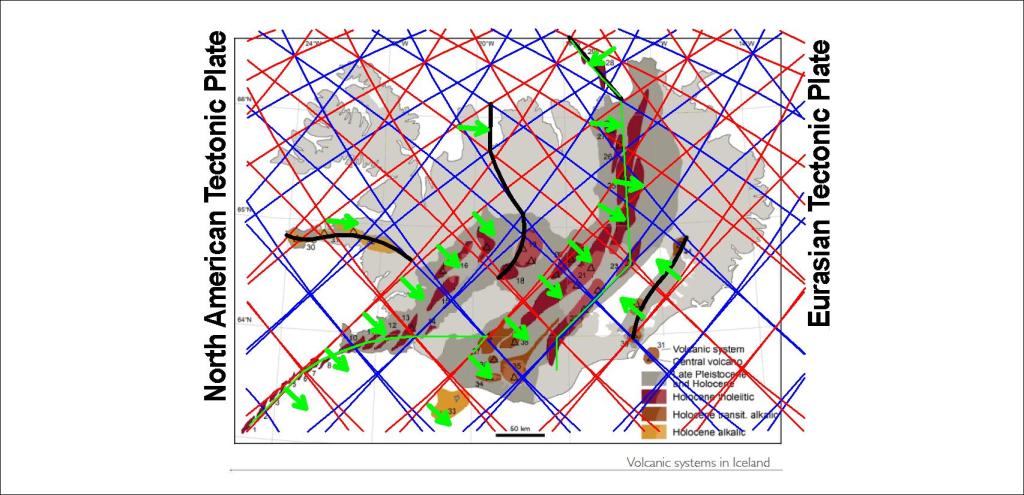
The concection rolls system within the Earth is regularly shaped, carrying heat to the surface. Two layers within the depth of 120-410 km are responsible for many tectonic and topographic features. The volcanic zones of Iceland can be traced accordingly. The first step is to see how the upper most rolls shape two of the main volcanic zones in Iceland, the West Volcanic Zone and the East Volcanic Zone.
Here, the upper most rolls are drawn with thicker lines for clarity.

Blue lines show down-welling, and there the volcanic zones terminate sharply at the eastern side. The East Volcanic Zone is the best example, because the rifting takes place exactly within the area marked by up-welling and down-welling lines.
The Reykjanes Ridge itself also provides a very easily understood example of how this system works. Therefore, the two rolls are drawn there.
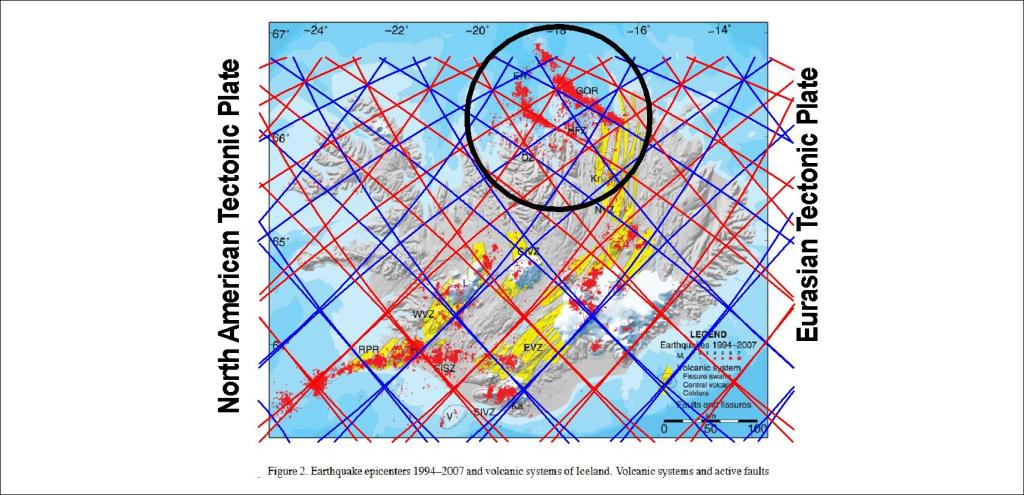
As this is nature, not man made system, it is represented in countless ways throughout the country. The earthquake epicenters also show some functional aspects of the grid of division lines of different layers.
It also has to be kept in mind that under Iceland between 120-410 km depth, there are actually four layers, due to the intersection between the two layers north of the country, and the other two layers south of it.