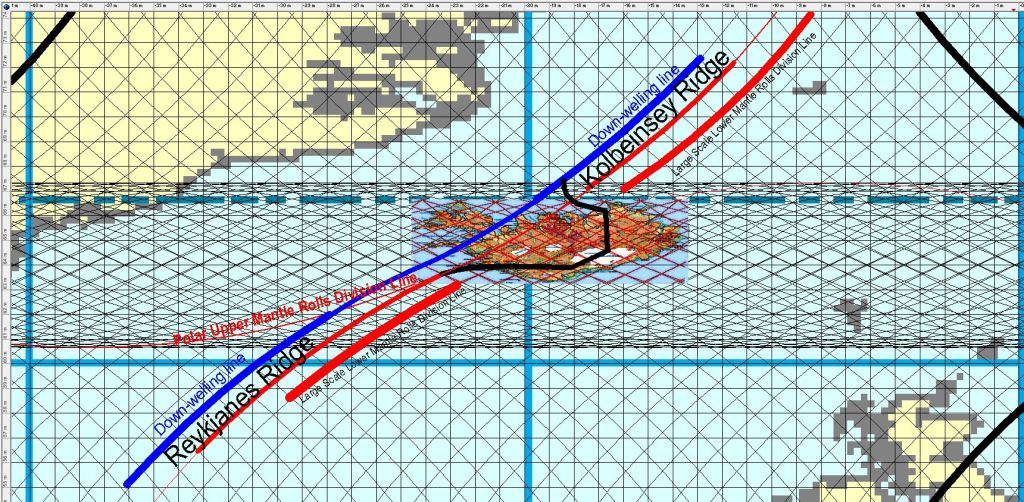
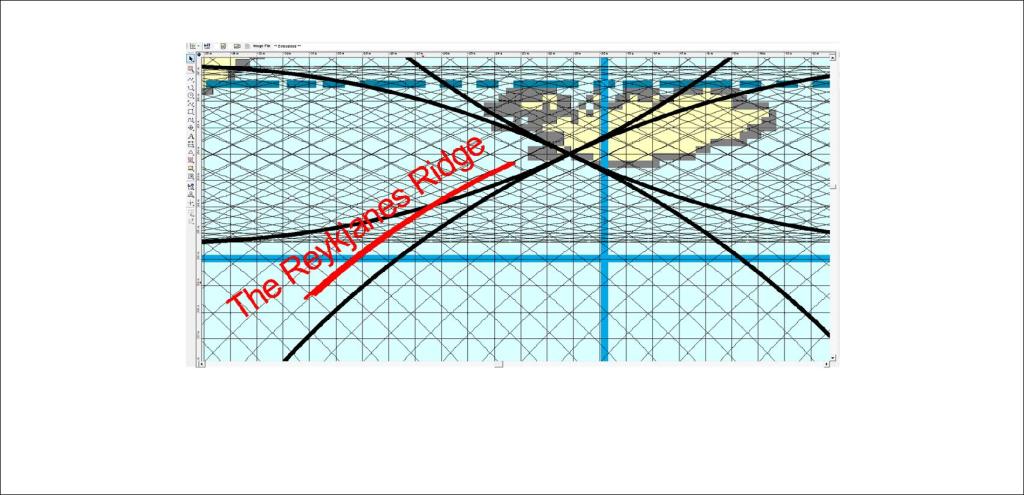
Geologists generally are aware of the connection between Reykjanes Ridge and Kolbeinsey Ridge. Here, the relevant convection roll is marked with red line for the up-welling division, and blue line for the down-welling part. By comparing with the exact location of the two ridges, the reason for the connection between them becomes clear.

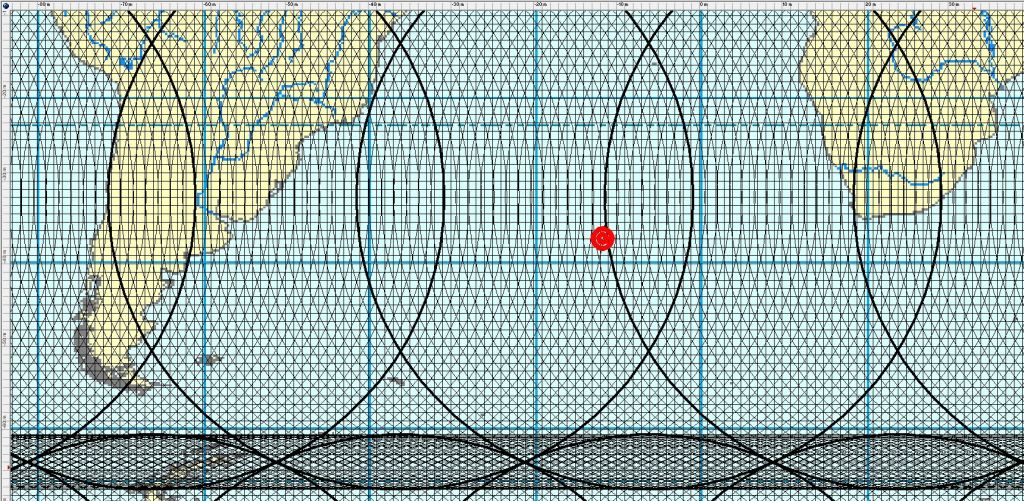
As latitude and longitude can be easily detected on this map, the consistence between real location and this theoretic alignment can be checked out.
The cnvection roll of Reykjanes Ridge is originally connected at 120 km depth with the tectonic plate, but within the intersection zone it becomes subducted by the polar convection rolls. North of the intersection zone, the convection roll found in between the blue and red lines is also connected with the tectonic plate at 120 km depth, and it is also the upper most roll within the intersection zone.
Kolbeinsey Ridge follows a different path than Reykjanes Ridge, and seems to be a consequence of similar process as creates the volcanic zones of iceland. The Reykjanes Ridge is on the contrary directly related to a single up-welling division line.