I am a geologist, graduated from the University of Iceland, and taught geology for a few years. I have gained some knowledge about Earth's inner structure, so I provide this website as my contribution to answer one of the greatest questions remaining within the realm of geoscience. Experiments show that the mantle should form convection rolls when close to the melting point. I took this literally, and calculated the dimensions and shape of these mantle convection rolls. Then I compare that model with the surface. This makes it possible to provide many interesting examples about geology found on my blog.
There are a few hotsprings in Iceland named Geysir. One is world famous and its name became used in general for spouting hot springs. The hot spring area of Geysir in Haukadalur of SW Iceland shows resemblance of Geysir at Hveravellir in the NE.
Here is a picture of the hot spring Strokkur in the area of Haukadalur.
Strokkur in Iceland
Both Geysers are located close to the main division line of lower mantle.
The two Geysir areas
The geothermal areas are known to have a distribution from SW to NE. The mantle division lines pattern is not known to almost everyone, so therefore this symmetry compared to the convectin rolls is shown here.
With 180 liters per second of boiling hot water, the world’s most powerful hot spring, Deildartunguhver, does stick out in the West of Iceland.
Deildartunguhver
The water is utilized for a spa called Krauma. As for other spa sites in Iceland, the location is easy to explain according to the forces underneath creating them.
The position of Deildartunguhver hot wpring and Krauma spa
One of the famous hot springs where people can take a bath is at Landmannalaugar. It is found in the middle of a polygon, with Hekla and Laki at each side.
The central position of Landmannalaugar within a polygon
Landmannalaugar are found at 64°N, the same parallel as Hekla and Laki. The latitude is also the central axis of the SISZ, extending from Hveragerði to Hekla. Repeatedly, we can trace the NS and EW-axis of different polygons. The ductile part of the tectonic plate, reaching 120 km down where convection of mantle starts to take place, gives way to the tectonic drift and breaks along the middle axis from one corner of the polygon to the other. Therefore this is repeatedly seen on the surface.
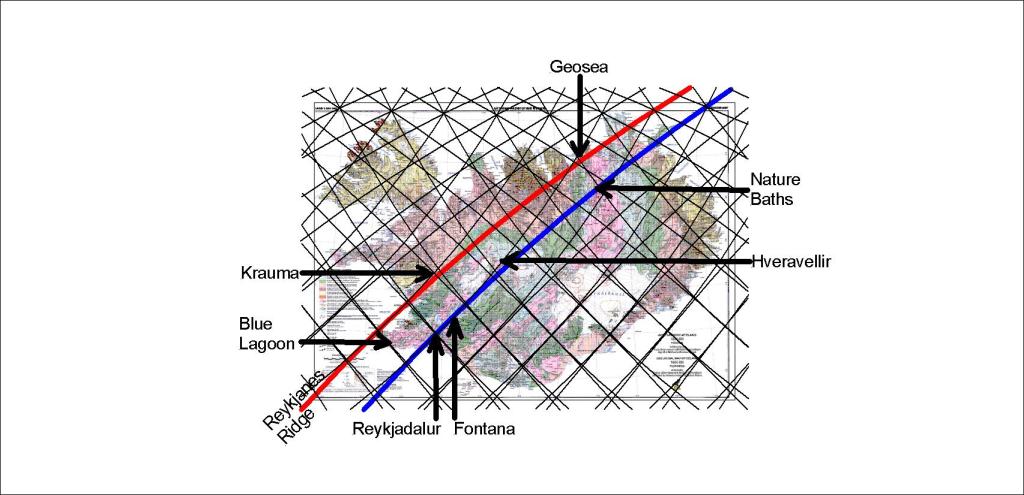
The Reykjanes Ridge can be extended over Iceland (red line), explaining the location of several geothermal spa sites in Iceland.
The geothermal baths in Iceland found along the main division lines of mantle convection rolls
The red line shows the Reykjanes Ridge and how the two relevant convection rolls extend over iceland. Over the division line, or close to it, the Blue Lagoon at Svartsengi, Krauma of Deildartunga, and Geosea of Skjálfandi Bay, near Húsavík are found.
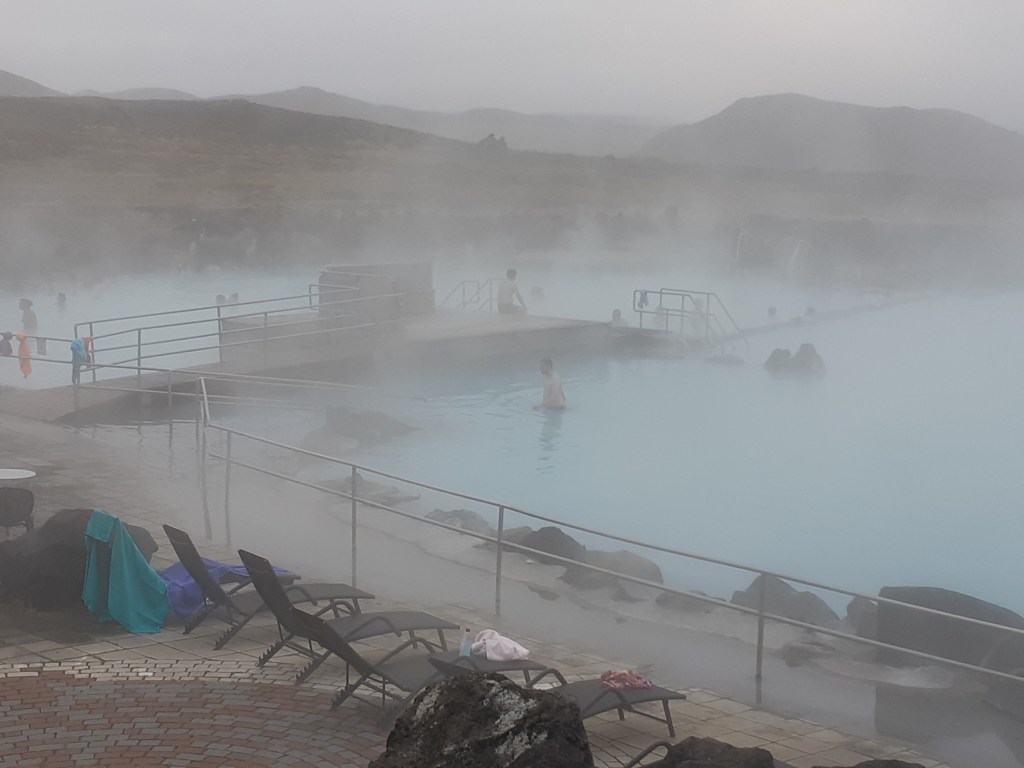
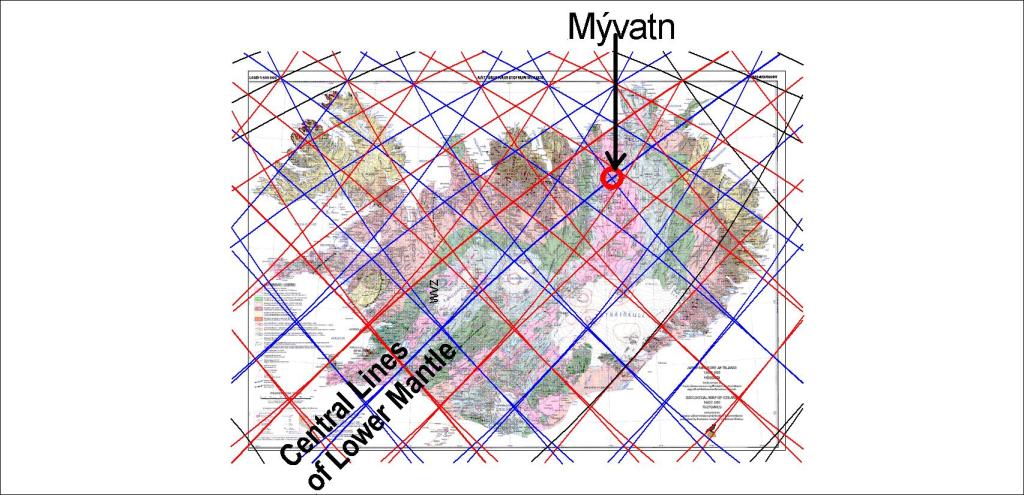
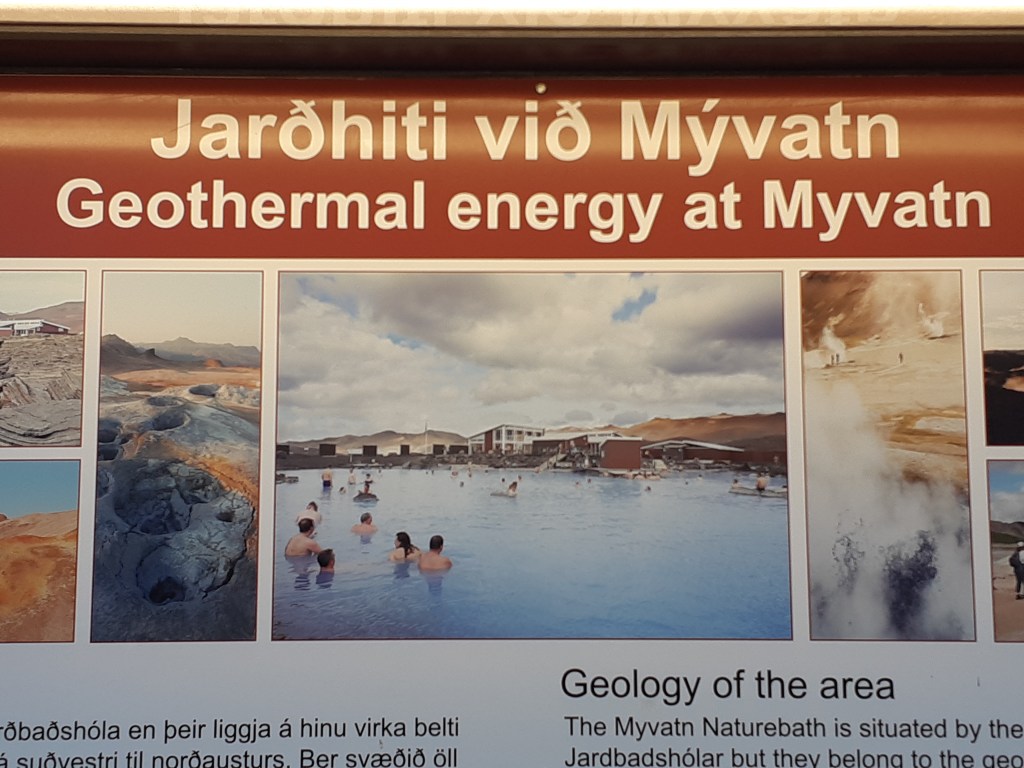
The blue line is actually the main division line of the two large convection rolls in lower mantle, but the upper most small convection rolls converge against each other. The division line marks the eastern edge of the West Volcanic Zone, where Fontana at Laugarvatn is located, and Nature Baths of Mývatn. It is also close to the Geysir area and Hveravellir in the center of Iceland. The Reykjadalur geothermal river has many bathing sites, near Hveragerði, which is of course on the blue line. Therefore, some additional points could be added with explanations according to the mantle currents pattern underneath. It is not necessary, though, because this shows the main pattern.
This shows the resemblance between convection rolls of the mantle and the main geothermal spa areas in Iceland.
Here is a list of web sites for those spa sites.
Krauma – at Deildartunga in Borgarfjörður area, West Iceland: