I am a geologist, graduated from the University of Iceland, and taught geology for a few years. I have gained some knowledge about Earth's inner structure, so I provide this website as my contribution to answer one of the greatest questions remaining within the realm of geoscience. Experiments show that the mantle should form convection rolls when close to the melting point. I took this literally, and calculated the dimensions and shape of these mantle convection rolls. Then I compare that model with the surface. This makes it possible to provide many interesting examples about geology found on my blog.
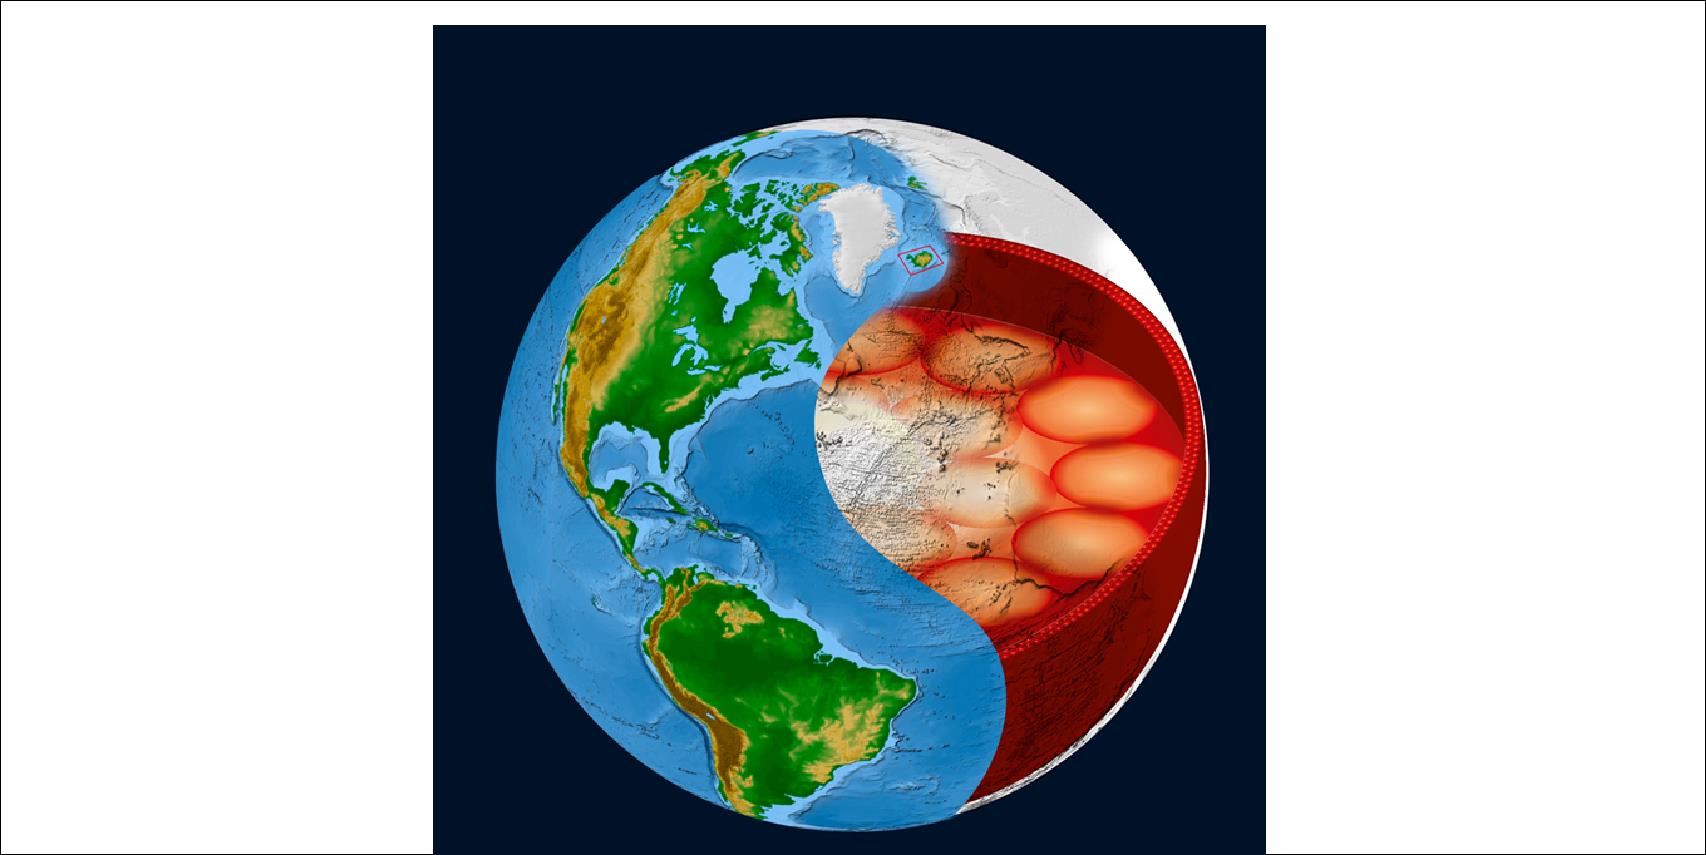
Humanity is missing something, not knowing about the mantle currents within the Earth. Here is a drawing for explanation:
The globe and the mantle current pattern within it
This is a beginning, as the layers of inner core, outer core and mantle are shown. The same laws of physics are used for the analysis for all the layers. Measurements and physics fit together! In other words: The measured thickness of each of Earth’s layers does match with an arrangement of convection rolls. These rolls are expected to form according to the laws of physics, namely convection within a rotating globe.
This measurement is as simple as possible, as along equator there are exactly 60° from Africa to South America. After billions of years of tectonic drift, this is a fact.
The convection rolls under the Atlantic Ocean
This can help us understanding the convection rolls system in general. And it can also teach us that nature behaves in a more complex way than we think at first. A linear thinking method makes us reason that the wideness of the ocean must be arbitrary. In nature, continuous movements are constantly subject to physics and show regularity and linear procedure at the same time. Understanding this, we can trace the tectonic drift backwards with more accuracy than before.
The equatorial section of Earth
The Atlantic Ocean spans two of those cells (sections of convection rolls), as can be seen here were the layers of Earth are drawn to scale.
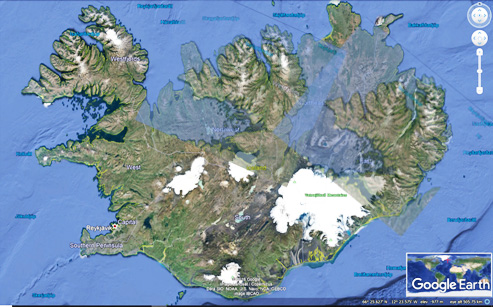
As different parts of Iceland resemble each others, and there is a reason to trace similar origin of them, could we then compare the parts geologically?
The Icelandic geological triplets of West Fjords Peninsula, North Coast and East Fjords
This can easily be done, even trying to find new things in one area by referring to what has been found in the other two areas.
Caution: Seeing this, people tend to overreact, trying to point something out which is not relevant. But this is science, with preconditions, calculations and results – and simplifications as well.
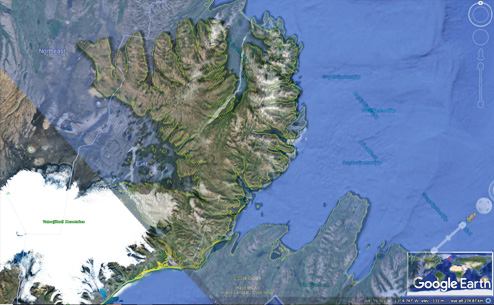
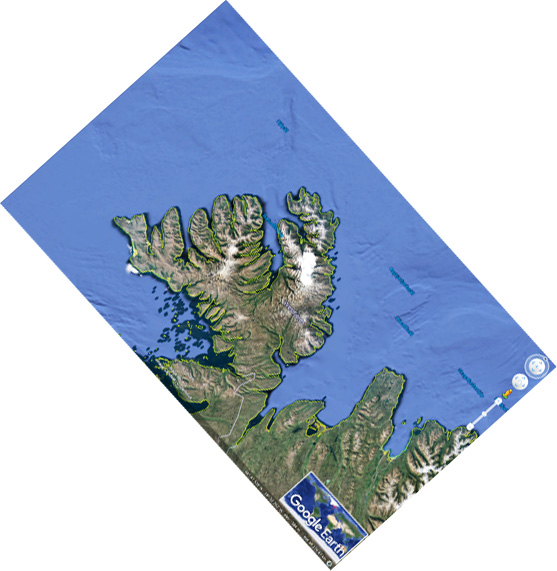
Down below, The NW Peninsula of Iceland (Vestfjarðakjálkinn) has been superimposed on a map of the Eastern Fjords. The coastlines are almost identical and also the inland features. Can this be explained? If originally built up in a parallel way, the shape can become more and less identical. The two coastlines are surprisingly similar. Similarities can be examined in a scientific way, calculating the probability that they will occur.
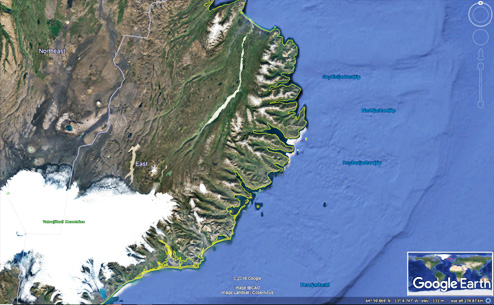
The strandir region overlapping the Eastern Fjords area of Iceland
To realize better what has happened, let us look at the two areas separately:
East Fjords areaThe West Fjords rotated 48°
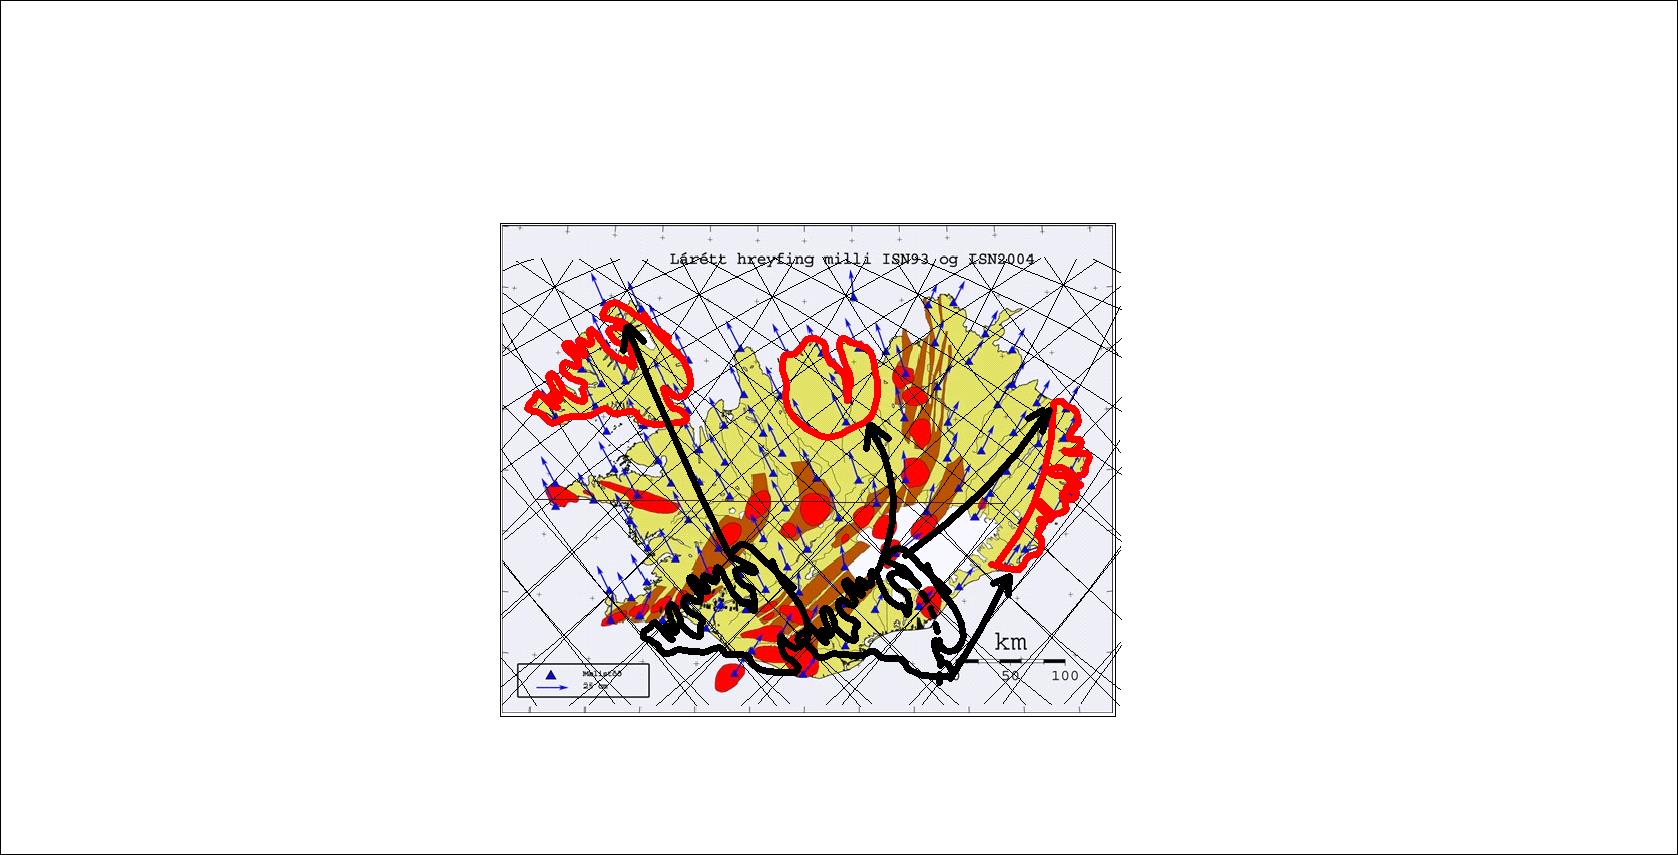
The overlapping is as perfect as possible, compared to having been subject to different circumstances for millions of years. No one would think of comparing these coastlines, unless first tracing the lines of tectonic drift. We can simply ‘play back’ the whole process according to GPS measurements of tectonic drift by tracing the vectors:
The East Fjords rotate, due to different velocity vectors for northern and southern parts. The Strandir region and East Fjords region are originated under similar conditions.
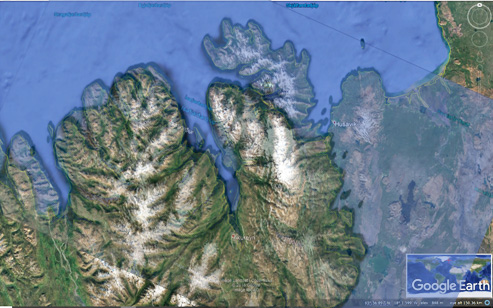
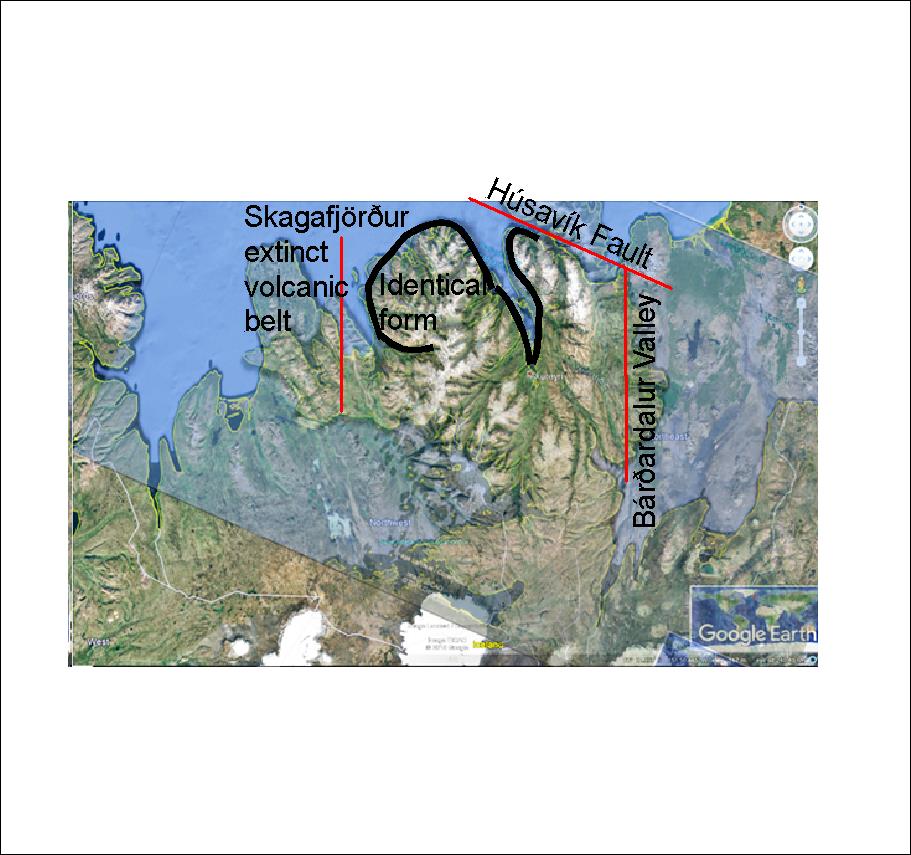
In addition, the Eyjafjörður and Tröllaskagi area can be compared with the West Fjord Peninsula, as by rotating Ísafjörður 24°.
The consistency is not only found to be intriguing becuse it ‘fits’ well, but because the rotation is half of that between the Strandir region and the East Fjord area. It is interesting to see how the Hornstrandir version of the peninsula east of Eyjafjörður has been removed by the Húsavík Fault System. It can also be seen that Arnarfjörður is narrower than Skagafjörður. It can be explained by the fact that for about a million years Skagafjörður was a volcanic zone taking part in the tectonic drift. Arnarfjörður is 6 km wide, compared with 16 km of Skagafjörður, which means that the widening of Skagafjörður during that period of time was close to 1 cm each year.
Comparison between these areas with basic explanations:
Adding the West Fjord Peninsula almost disappears into the North of Iceland, and the Tröllaskagi Peninsula has a very similar system of valleys as the Peninsula. Every detail and every piece of geological knowledge does add to the understanding of these geologically related areas.
The three West Fjord Peninsulas
This seems amazing, but how is all this duplicated? As usually it has to be traced with a lot of work. Look for instance at Lagarfljót, and how it resembles Ísafjörður and Eyjafjörður! Crazy!
Looking at the foundations of Iceland at 64°N shows how the geology along the latitude is divided into distinct ‘chapters’.
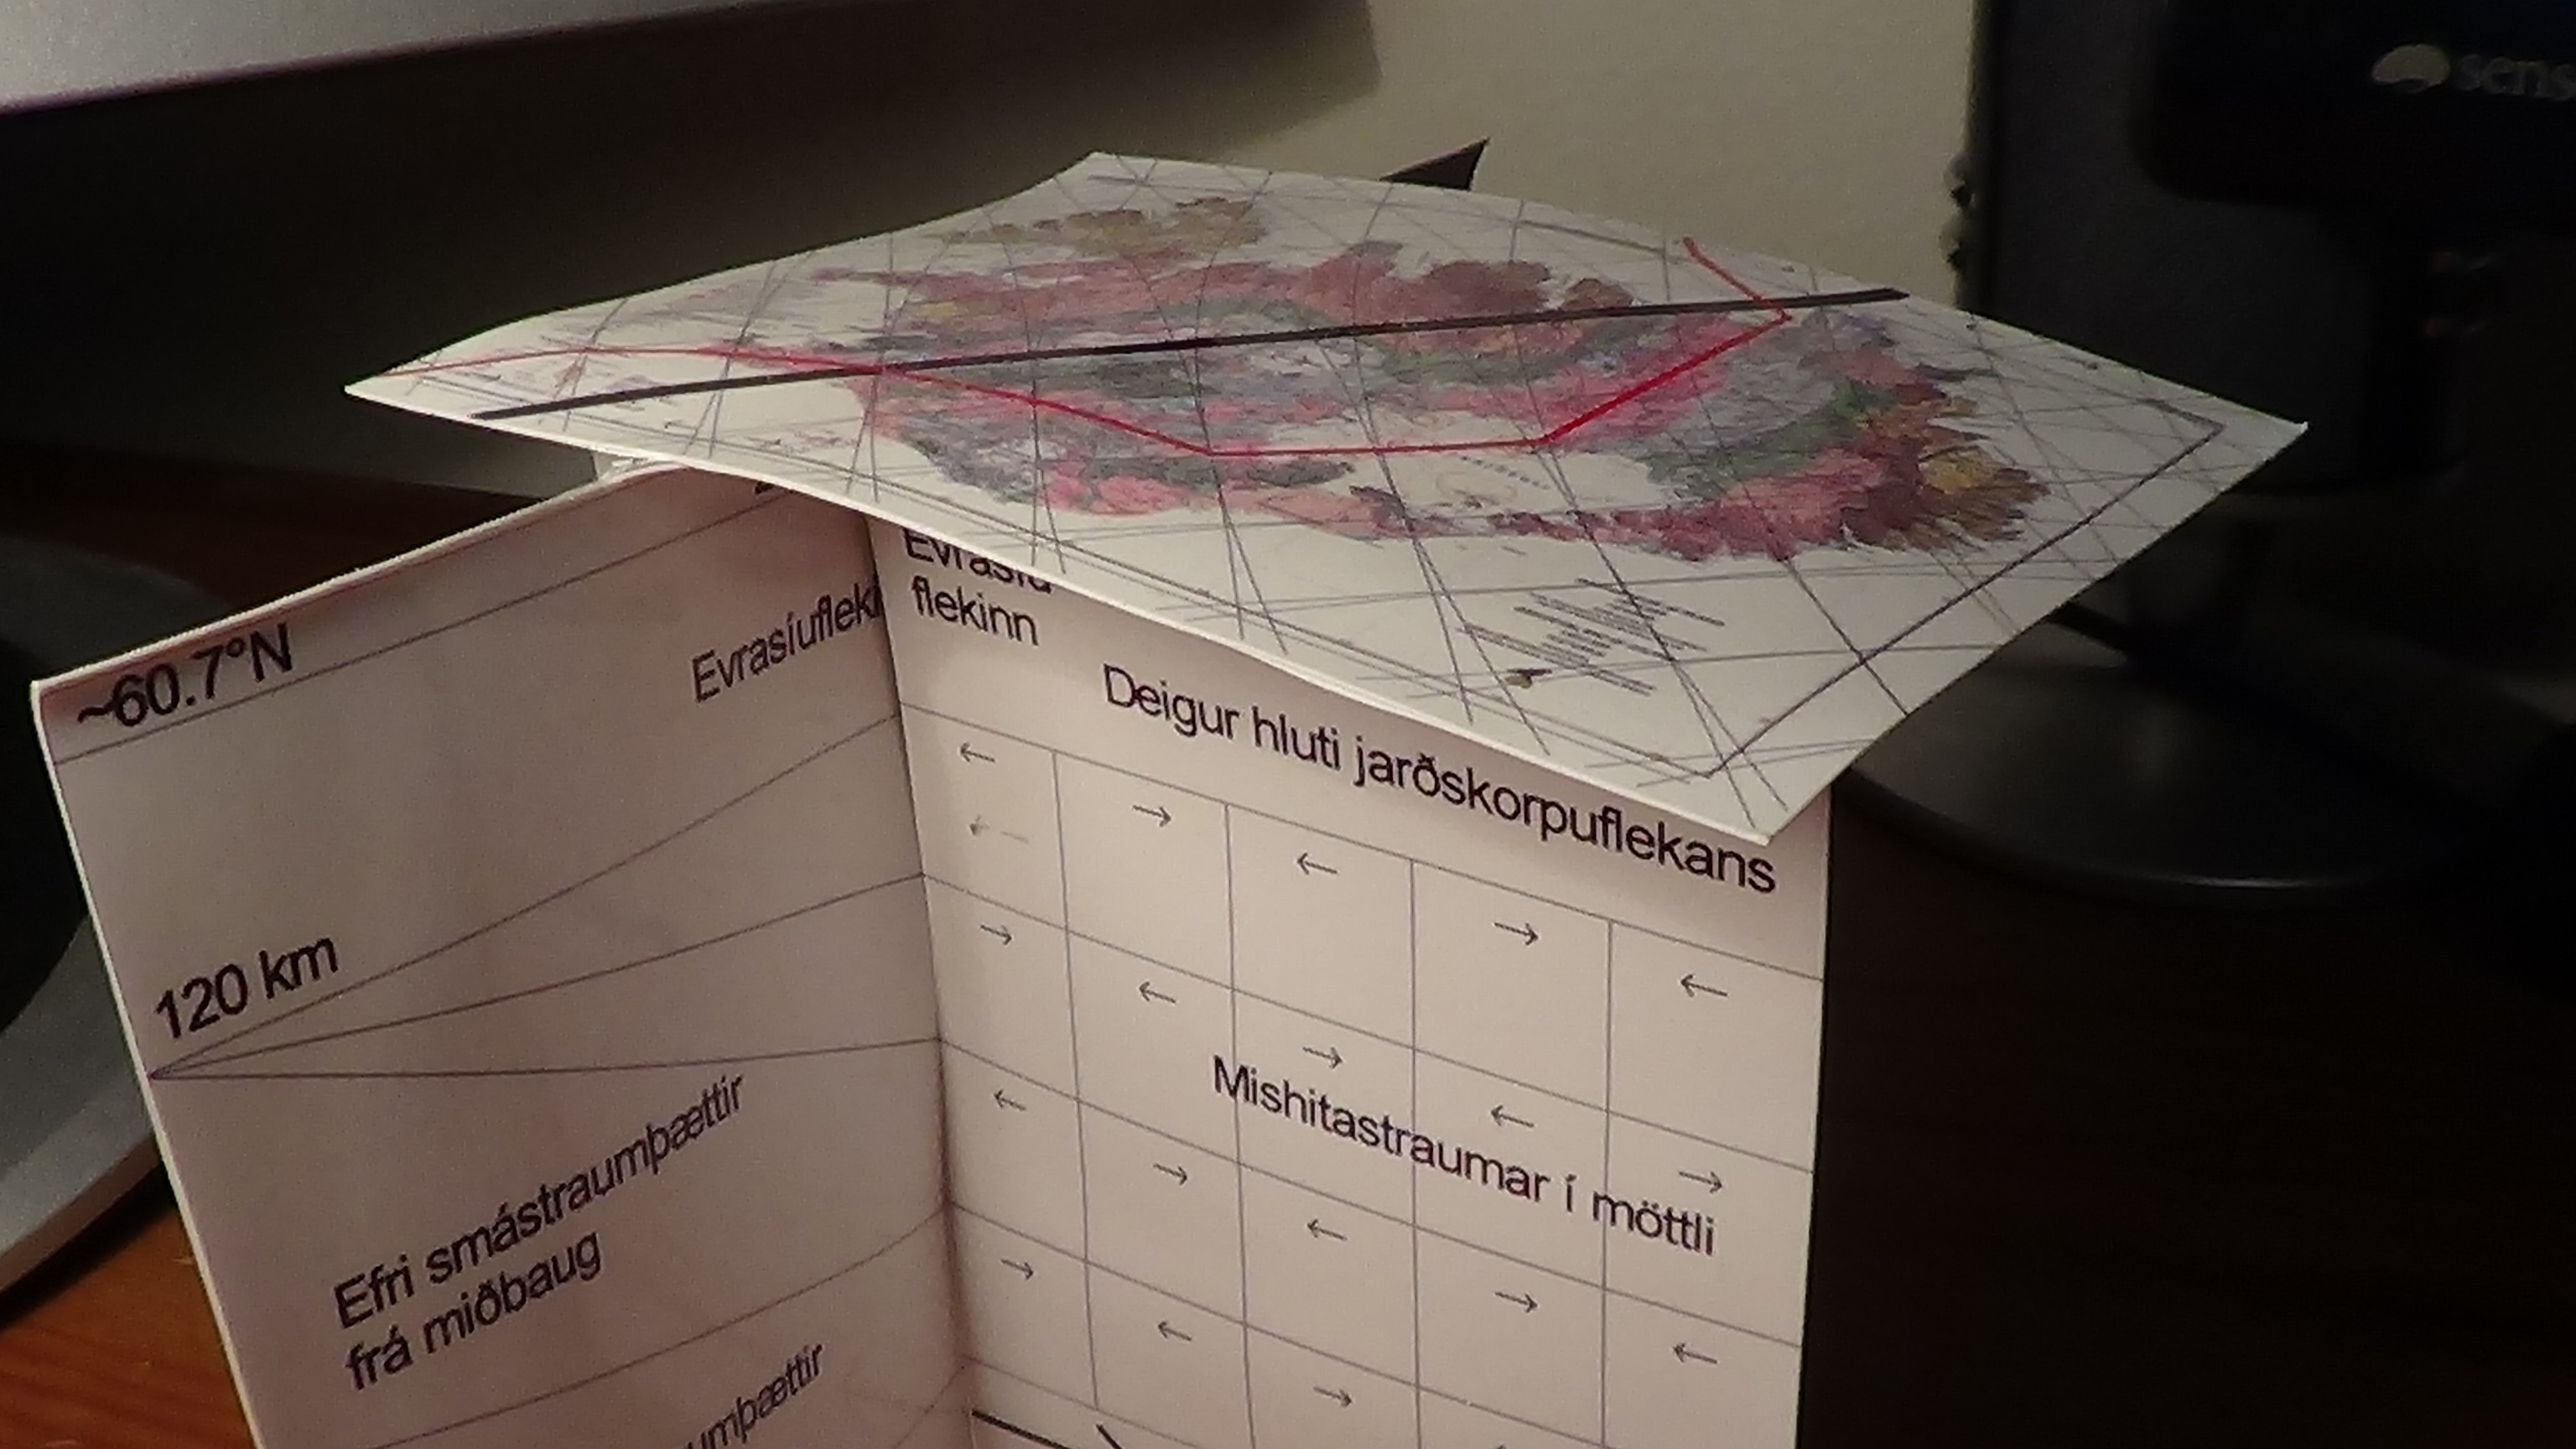
Iceland with tectonic plate down to 120 km, then layers of convection rolls as they are organized along 64°N. The thickness within the intersection zone of individual layers is also shown.
The convection roll shown farthest to the left is at the main division line over the large convection cells of lower mantle. It is marked with bold black line over the country from SW to NE. With 3D models like this one it becomes possible to understand the pattern of convection rolls under the tectonic plates all over the world.
Of course, this can still not be understood by looking at this model. The picture is published here just to show that the model has been derived, and everyone interested in the subject can learn about it. This has hitherto been a huge gap in the knowledge spectrum of geoscience.